Note: This is now also part of the official documentation on docs.microsoft.com: Use Azure Data Explorer to query raw information logs – Finance & Operations | Dynamics 365 | Microsoft Docs. I will continue to maintain the samples at the end of this blog.
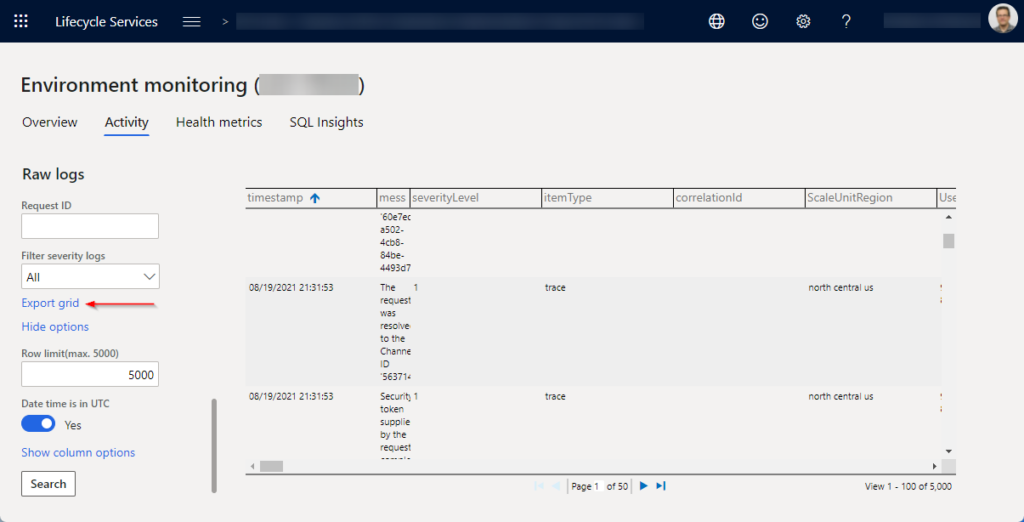
There are occasions when a customer, partner, consultant, or support engineer needs to look at the low-level Dynamics 365 Finance & Operations telemetry data. These use cases include troubleshooting of errors, performance-related investigations or just to gain some additional understanding of how the platform work. Telemetry data can be accessed by authorized users via the Environment monitoring part of the LCS portal, can be filtered in a few different ways and displayed inside the LCS portal’s raw logs section. A data grid can be used to inspect the log entries. LCS does not allow for more sophisticated pivoting and users can use Excel for that purpose. For that purpose, the telemetry data can also be downloaded formatted in CSV format.
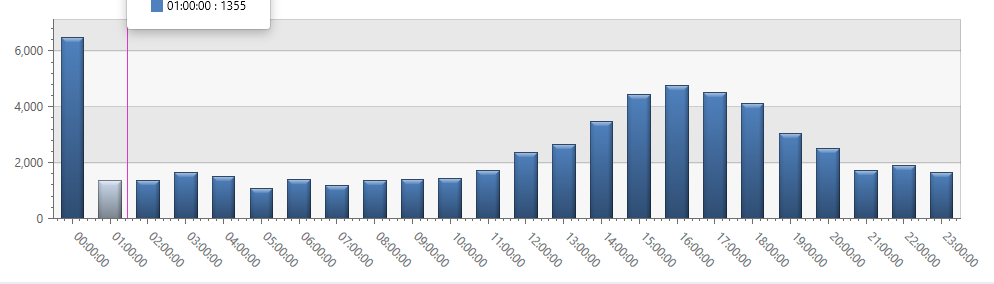
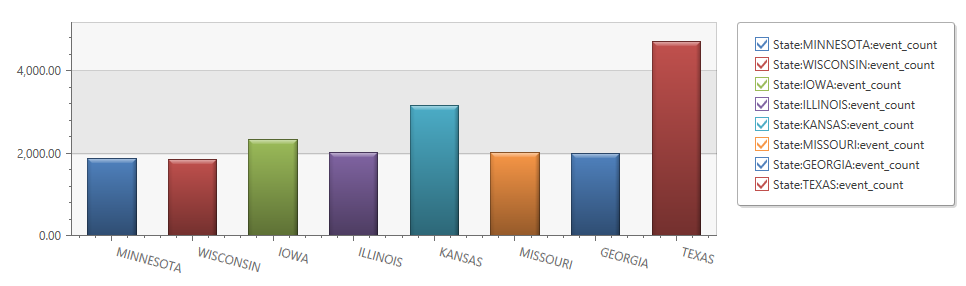
However, Excel is not the optimal tool for advanced querying of this data. The perfect tool, designed for this purpose is the Azure Data Explorer. It provides an innovative query language Kusto that is optimized for high-performance data analytics. Answering questions like “how often has a certain process taken place, how long has it taken in 90% of the times, how often per hour has a certain action taken place over the course of a day” becomes a lot easier and can be backed up with powerful graphics as well.
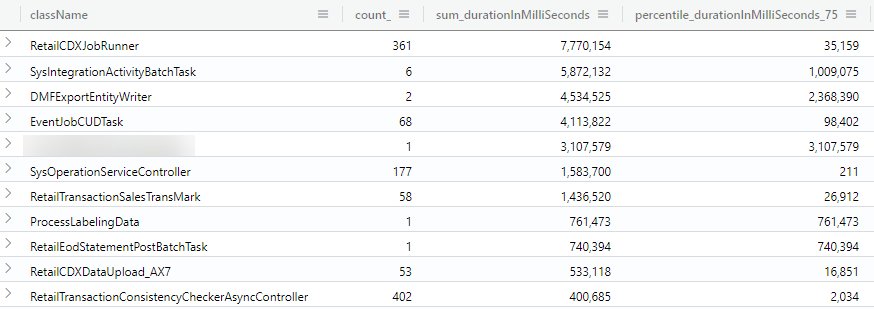
Here are examples how the graphics could look like:
A less known feature of the Azure Data Explorer is that it supports ingestion of CSV files. We can use it to get our CSV data files uploaded and staged so it can be queried with the Kusto language. If you have not setup Azure Data Explorer Cluster, follow these steps.
Steps to upload to Azure Data Explorer
- Run your query on LCS raw logs page
- Important: adjust the time interval or – filter to get to the right data (row limit is 5000 for export in next step)
- export the grid to Excel
- Open the file in Excel and save it without making any changes (this seems to fix a formatting issue)
- In your Azure Data Explorer, right click on the cluster in the tree view and select “ingest new data” and then on the next page “ingest data from a local file”
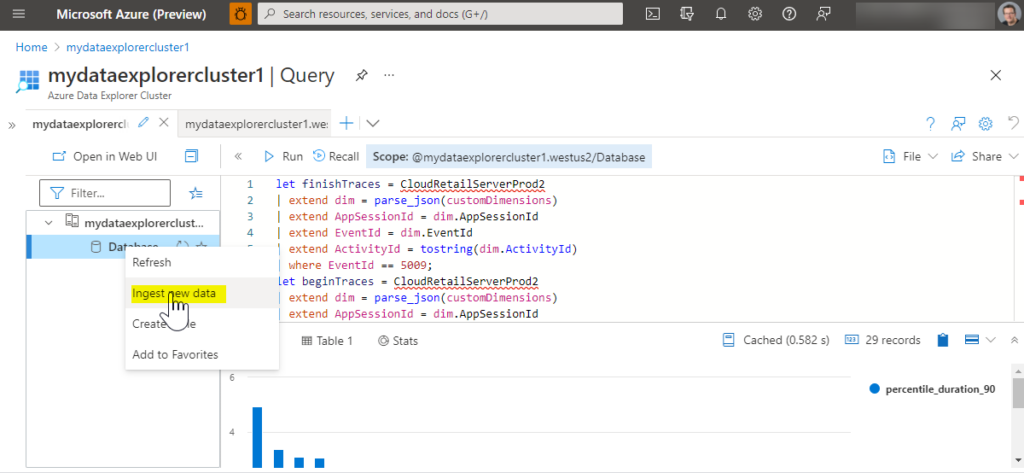
- Pick your cluster, name a new table for the data to be imported into, select up to 10 CSV files to import, select CSV format. Hit next a few times till your data is getting imported.
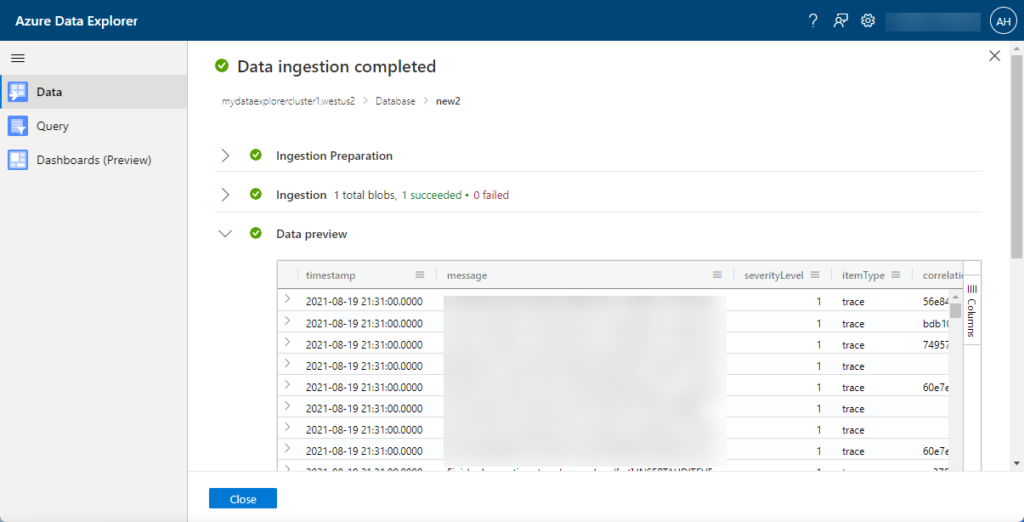
- Use the Query tile to write a Kusto query against your data.
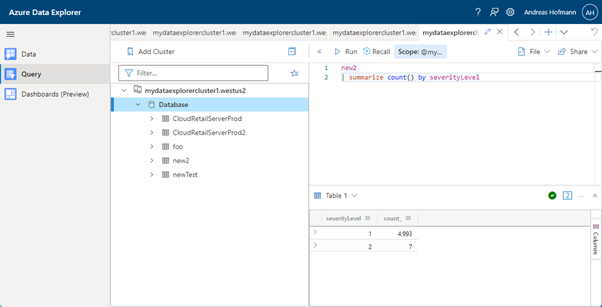
To learn more about the Kusto query language, go here.
Sample queries
Modern POS
all errors
Sometimes its nice to get an idea of what all the errors are. The use of the text fields to describe errors is not consistently used, so its better to use the EventIds and map them to the correct errors. They can be looked up in these two Commerce SDK files (but using the code snippet below may give you all of them already):
- Pos.RetailLogger.js
- Microsoft.Dynamics.Retail.Diagnostics.Sinks.man
// Note: Filter EventSeverity == Error before exporting/ingesting
MPosErrors24h
| extend EventName = case(
EventId == 53231, "runtimeInterceptorFailed",
EventId == 48434, "posPaymentTerminalAuthorizeRefundActivityFailed",
EventId == 48347, "posAuthorizeOrRefundPaymentFailed",
EventId == 48104, "posTenderPaymentOperationFailed",
EventId == 46802, "extensibilityFrameworkExecuteRuntimeRequestFailed",
EventId == 44322, "viewModelCartProcessTextFailed",
EventId == 42112, "viewModelCartProcessTextFailed",
EventId == 42106, "RetailProxyExtensionAdapterManagerMethodNotFound",
EventId == 40450, "posInitiatedHardwareStationRequestFailed",
EventId == 40409, "peripheralsBarcodeScannerEnableFailed",
EventId == 40325, "operationSetQuantityOptionsValidationFailed",
EventId == 40255, "RetailOperationFailed",
EventId == 40209, "coreRetailOperationOnExecutingFailed",
EventId == 40191, "modelManagersChainedRequestExecutionFailed",
EventId == 40170, "modelManagersErrorParserHardwareStationError",
EventId == 40150, "modelManagersChainedRequestFactoryExecuteOfflineLogonRequestUnAvailable",
EventId == 40104, "ModelManagersCommerceRuntimeRequestError",
EventId == 40101, "ModelManagersRetailServerRequestError",
EventId == 7505 , "PaymentConnectorLogErrors",
EventId == 7503 , "PaymentConnectorLogException",
EventId == 7014 , "HardwareStationActionFailure",
EventId == 1001 , "CrtExecuteRequestErrorFailure",
strcat("*************** Unknown EventId: ", EventId))
| where EventSeverity == "Error"
| summarize count() by EventId, EventName
| order by count_ desc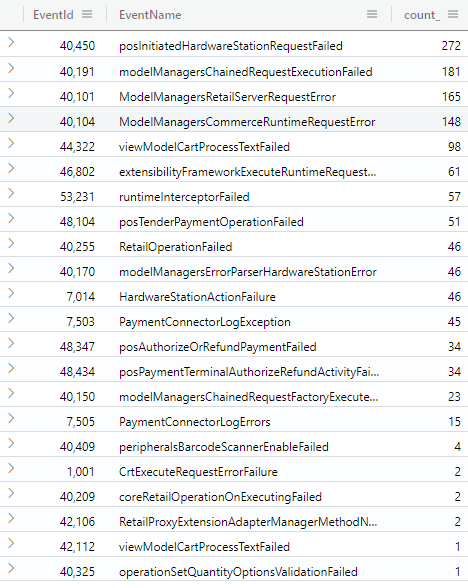
Now, its easier to decide where to look next, i.e. what more detailed queries to issue for specific errors…
Errors returned by RetailServer
// Note: Filter EventSeverity == Error before exporting/ingesting
MPosErrors24h
| extend EventName = case(
EventId == 53231, "runtimeInterceptorFailed",
EventId == 48434, "posPaymentTerminalAuthorizeRefundActivityFailed",
EventId == 48347, "posAuthorizeOrRefundPaymentFailed",
EventId == 48104, "posTenderPaymentOperationFailed",
EventId == 46802, "extensibilityFrameworkExecuteRuntimeRequestFailed",
EventId == 44322, "viewModelCartProcessTextFailed",
EventId == 42112, "viewModelCartProcessTextFailed",
EventId == 42106, "RetailProxyExtensionAdapterManagerMethodNotFound",
EventId == 40450, "posInitiatedHardwareStationRequestFailed",
EventId == 40409, "peripheralsBarcodeScannerEnableFailed",
EventId == 40325, "operationSetQuantityOptionsValidationFailed",
EventId == 40255, "RetailOperationFailed",
EventId == 40209, "coreRetailOperationOnExecutingFailed",
EventId == 40191, "modelManagersChainedRequestExecutionFailed",
EventId == 40170, "modelManagersErrorParserHardwareStationError",
EventId == 40150, "modelManagersChainedRequestFactoryExecuteOfflineLogonRequestUnAvailable",
EventId == 40104, "ModelManagersCommerceRuntimeRequestError",
EventId == 40101, "ModelManagersRetailServerRequestError",
EventId == 7505 , "PaymentConnectorLogErrors",
EventId == 7503 , "PaymentConnectorLogException",
EventId == 7014 , "HardwareStationActionFailure",
EventId == 1001 , "CrtExecuteRequestErrorFailure",
strcat("*************** Unknown EventId: ", EventId))
| where EventSeverity == "Error"
| where EventId == 40101
| summarize count() by requestAction, error
| order by count_ desc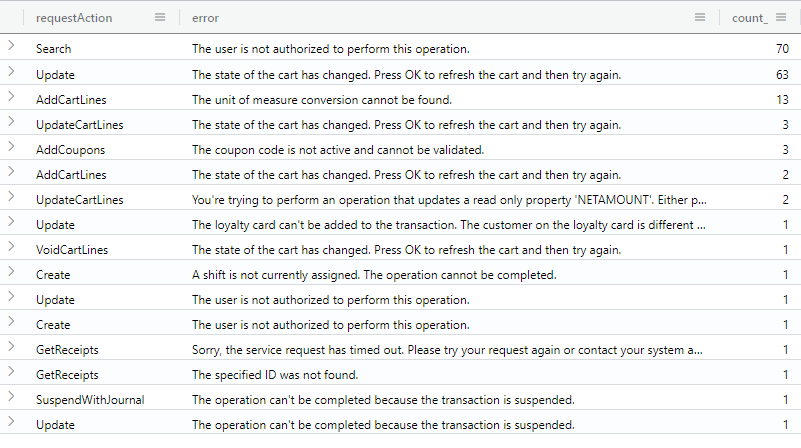
CSU
All errors
Similarly to the MPOS errors, we can get them from the CommerceSDK (Microsoft.Dynamics.Retail.Diagnostics.Sinks.man)
// Note: Filter EventSeverity == Error before exporting/ingesting
CSUErrors24h
| extend EventName = case(
EventId == 1017, "CrtSlowHandlerExecution",
EventId == 1005, "CrtExecuteRequestWarningFailure",
EventId == 5055, "RetailServerRequestWarningFailure",
EventId == 60208, "SyncLibraryMergeDataIntoTableWarning",
EventId == 60125, "ProcessDeleteRequestStart",
EventId == 2617, "CrtWorkflowUserAuthenticationRequestHandlerFailure",
EventId == 2486, "CrtServicesEmployeePasswordDoesNotMatch",
EventId == 5106, "RetailServerSecretRetrievalWarning",
EventId == 2503, "CurrencyServiceGetSupportedChannelCurrenciesNotFound",
EventId == 6943, "RtsClientLibraryApiExecutionWarning",
EventId == 3007, "CrtTransactionServiceClientRtsExecutionWarning",
EventId == 2413, "CrtServicesSalesOrderTransactionServiceMarkReturnedItemsFailure",
EventId == 2483, "CrtServicesLocalLogonFailedDueToIncorrectStaffId",
strcat("*************** Unknown EventId: ", EventId))
| summarize count() by EventId, EventName
| order by count_ desc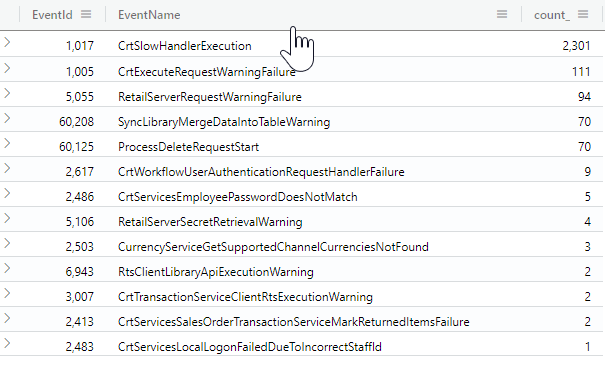
A next step would be to go through each of these error types, and look at them closer. A few of those could indicate quality issues that could effect the user experience.
In many cases, these errors can be fixed by cleaning up the extended code, adding proper SQL indexes or investigate better problem approaches.
In some cases, these errors could indicate problems with out-of-box experience (OOBE) or deployment. Please open a support request to get these fixed by Microsoft.
Slow CRT handlers by requesttype
// Note: Filter EventSeverity == Error before exporting/ingesting
CSUErrors24h
| extend EventName = case(
EventId == 1017, "CrtSlowHandlerExecution",
EventId == 1005, "CrtExecuteRequestWarningFailure",
EventId == 5055, "RetailServerRequestWarningFailure",
EventId == 60208, "SyncLibraryMergeDataIntoTableWarning",
EventId == 60125, "ProcessDeleteRequestStart",
EventId == 2617, "CrtWorkflowUserAuthenticationRequestHandlerFailure",
EventId == 2486, "CrtServicesEmployeePasswordDoesNotMatch",
EventId == 5106, "RetailServerSecretRetrievalWarning",
EventId == 2503, "CurrencyServiceGetSupportedChannelCurrenciesNotFound",
EventId == 6943, "RtsClientLibraryApiExecutionWarning",
EventId == 3007, "CrtTransactionServiceClientRtsExecutionWarning",
EventId == 2413, "CrtServicesSalesOrderTransactionServiceMarkReturnedItemsFailure",
EventId == 2483, "CrtServicesLocalLogonFailedDueToIncorrectStaffId",
strcat("*************** Unknown EventId: ", EventId))
| where EventId == 1017
| summarize count(), sum(inclusiveExecutionTime), percentiles(inclusiveExecutionTime, 75, 90) by handlerAssemblyName, requestType
| order by sum_inclusiveExecutionTime desc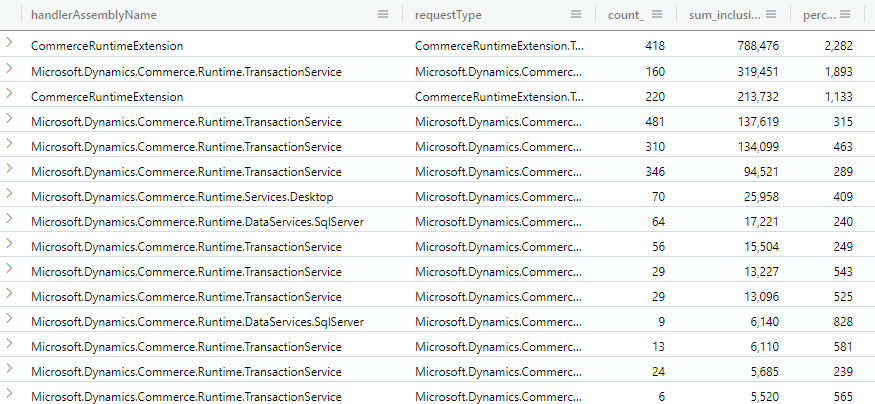
F&O
All errors
// Note: use selection "All error events" to only get the errors
FNOErrors24h
| summarize count() by formName, targetName, errorLabel
| order by count_ desc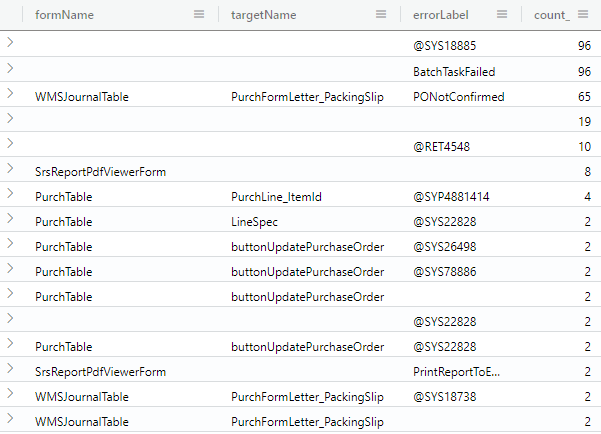
FormName, targetName, errLabel are all good candidates to look up in Azure DevOps to find out the code location. That gives more insight in what areas these error occur.
Example: The @SYS18885 is thrown from ReqPlanData class. Now I can focus on figuring out why that is the case (is Master planning not configured right?)
Slow SELECT queries
// use selection "slow queries" in LCS diagnostics
SlowQueries
| extend MainTableName = extract("FROM\\s([A-Z0-9]+)\\s", 1, statement)
| where statement contains "SELECT"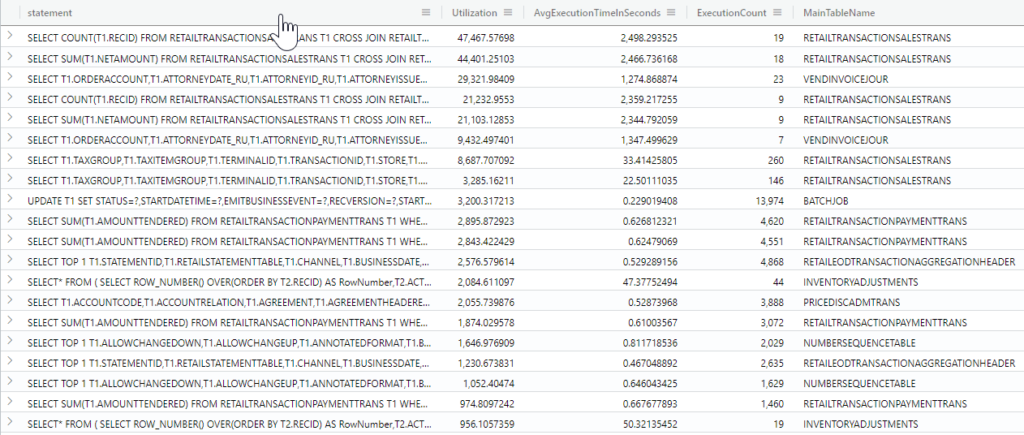
slow inserts
// use selection "slow queries" in LCS diagnostics
SlowQueries
| extend MainTableName = extract("INSERT INTO ([A-Z0-9]+)\\s", 1, statement)
| where statement contains "INSERT"
Slow deletes
// use selection "slow queries" in LCS diagnostics
SlowQueries
| extend MainTableName = extract("DELETE FROM ([A-Z0-9]+)\\s", 1, statement)
| where statement contains "DELETE FROM"
Batch jobs performance
// use selection "All logs" and add query "where TaskName Equals BatchFinishedOneTask" in LCS diagnostics
BatchFinishedOneTask
| summarize count(), sum(durationInMilliSeconds), percentiles(durationInMilliSeconds, 75, 90) by className
| order by sum_durationInMilliSeconds desc