Implementing Retail Store Credit Card discounts


This post originally appeared on Implementing Retail Store Credit Card discounts.

An often-requested Dynamics Retail channel feature is the support of store credit cards. The retailer wants to encourage the use of a store credit card; so if the customer uses it, he should get a discount percentage.

Ideally, we should be able to configure the discount percentage, the products that should apply or not, and certain other ordering rules for the discount (apply on-top of other discounts or replace other discounts if better, etc.). The retailer should be able to configure these in Headquarters (AX) without changes in the channel.

This discount applies only during or right before payment, it cannot be applied during simple add-to-cart operations, like other discounts.

Modelling the discount as an affiliation

The pricing or discount engine is a complex piece of code. Even though it supports extensibility features, I would rather not go there. Is there an easier way to do that? Yes, there is. Read on…

We do not want to apply the associated discounts automatically but rather only when a special store credit card is used. We can use affiliation and affiliation price groups to achieve that. The only thing we need to “code” is the application of the affiliation to the cart at the right moment (right when the customer checks out with a store credit card).

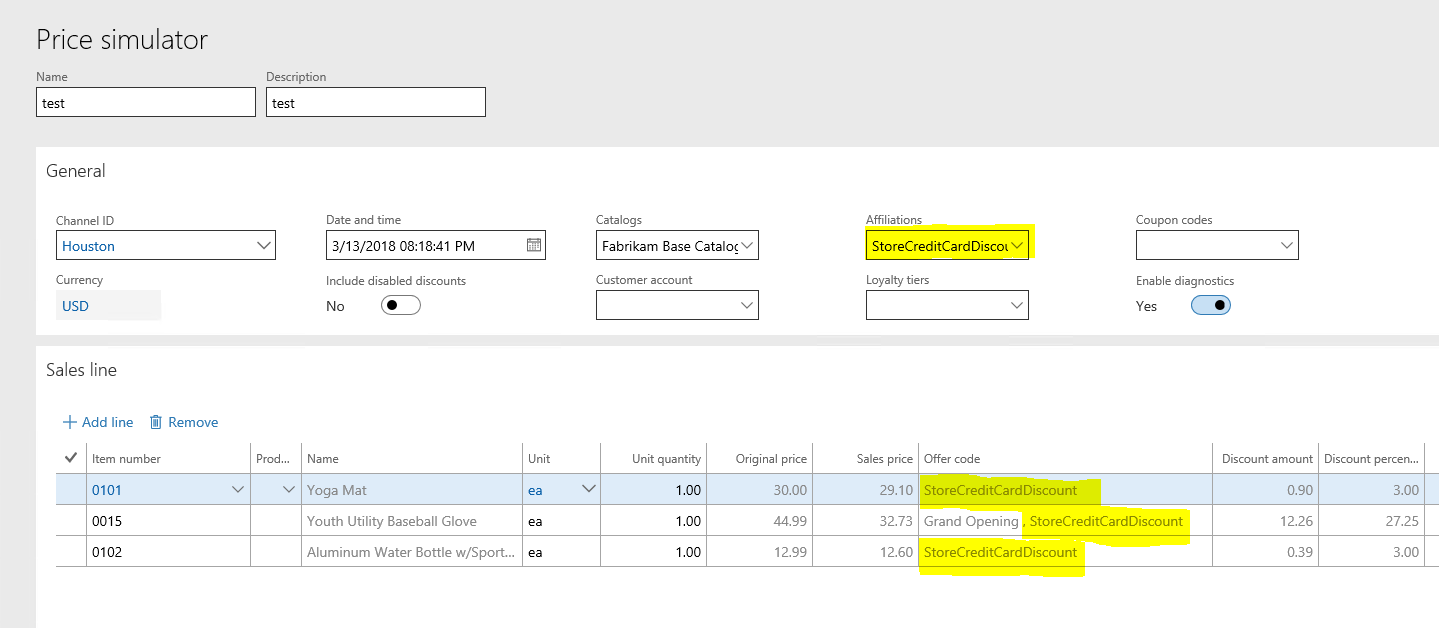
A nice benefit of not needing pricing extensions is that we can use the Price simulator in HQ to verify that our discount rules are correct.

In order to try this out, we need to create a new discount for the products we want, with the right percentage, associate with a price group and add it to an affiliation.

As soon as we save, we can try it out in the Price Simulator. Below, you can see that the store credit card discount is applied to all projects, but other discounts are honored (because the StoreCreditCardDiscountAffiliation was set). As soon as the affiliation is removed from the General section, the discounts would disappear.

Applying the store credit card discount in POS

As mentioned above, we only need to apply correct affiliation to the cart before we checkout, and we are done. That functionality already exists in POS today. So, to simply try this out, I did not need to make any code changes (POS transaction screen -> Discounts -> Add affiliation):

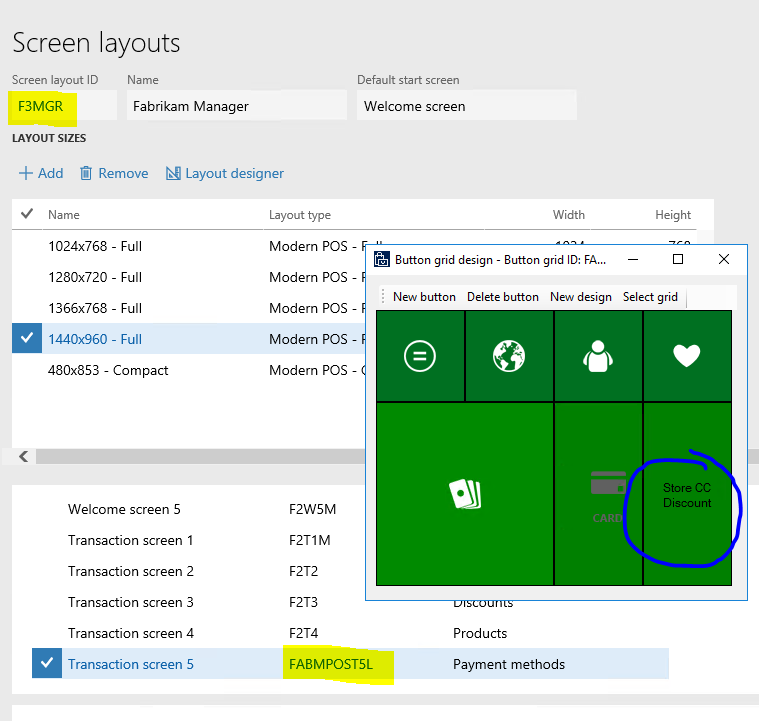
Ideally, this affiliation should only be added right before the store credit card is being used. Therefore I opted for adding a new button next to the “Pay Card” button that will do all the work and the cashier would not need to do this via the “Add Affiliation” operation. See the steps below for details.

It would even be better to “detect” that the credit card is a store credit card and only then apply the affiliation. However, it turned out that this may not be easily doable today, as the payment view in POS does not support this. Hence, I opted for the slightly more manual option where the cashier has choose the button.

Here are the steps to add the button to POS:

    • In HQ, add a new operation (i.e. StoreCreditCardDiscountAffiliation, 5000)
    • In the layout designer, edit the button grid and add the button and associate it with the new operations

    • Run these jobs: 1050 for Affiliation price groups, 1020 for discount, 1090 for the button grid changes
    • In POS.Extensions project, create a new project StoreCardDiscountExtension, with a new operation mapped to the same Id created earlier, and in there just add the affiliation to the cart.

public executeAsync(request: StoreCardDiscountOperationRequest): Promise<ClientEntities.ICancelableDataResult> {

    let addAffiliationRequest: CartOperations.AddAffiliationOperationRequest =
        new CartOperations.AddAffiliationOperationRequest(["StoreCreditCardDiscountAffiliation",], [], request.correlationId);

    return this.context.runtime.executeAsync(addAffiliationRequest)
        .then((
            result: ClientEntities.ICancelableDataResult
        ): ClientEntities.ICancelableDataResult => {

            return <ClientEntities.ICancelableDataResult>{
                canceled: result.canceled,
                data: new StoreCardDiscountOperationResponse()
            };
        });
}

The POS extension code is attached below in zip format.
StoreCardDiscountPosExtensions

Applying the store credit card discount in online channel

The same discount logic as above is executed automatically, as we use built-in concepts around discounts (as long as RetailServer is being called). However, just as in POS, we need to add the affiliation to the cart at the right moment. In eCommerce, we can accomplish this by updating the “AffiliationLines” property of the Cart object.

Since in eCommerce the payment process is a wizard with multiple steps, we do not need to add a new UI action to apply the discount affiliation. We can handle this better by detecting the use of a store credit card by number, then apply the affiliation automatically (form the UI or 3rd party ecommerce wrapper). The customer should see the updated cart, while moving to the next payment step.

Retail Channel performance investigations

This post originally appeared on https://dynamicsnotes.com/retail-channel-performance-investigations/.

There may be a time during a Retail project when you likely will hear someone saying: “Doing X in POS is slow. What’s going on?”. If this is the case, my hope is that this during the implementation phase and not on a live production environment.

What do we do to find out what is wrong? Is it a customization to the CRT business logic, latency to an external call, generic latency to the server from POS, or a Microsoft bug?

The following steps will hopefully help to give an answer to these questions.

Latency between POS and RetailServer

RetailServer API timings as seen from POS

Simulating network “issues”

“Looking inside” RetailServer/CRT/SQL with Commerce Runtime Analyzer

Profiling Channel database SQL queries

Some things to remember:

RetailServer could be either Microsoft hosted or RSSU-hosted. It is agnostic to this investigation, but you need to make sure you are testing against the right RetailServer (especially if you use both Microsoft-hosted and RSSU-hosted at the same time).

Microsoft-hosted RetailServer in production cannot be accessed, so some of the steps below cannot be carried out on a production environment. It is advised to carry these out on a lower tier environment.

RSSU-hosted RetaiSserver, even in production, is under the management of the customer, so the steps below can be carried out, but with care.

Sometimes the slowness could occur only when there are multiple POS used at the same time. If that is the case, you can still use the steps below, but would have to reproduce the issue by running multiple POS.

Profiling Channel database SQL queries


This post originally appeared on https://dynamicsnotes.com/profiling-channel-database-sql-queries/.

The information below is not particular to the Retail Channel or Dynamics 365 F&E databases. It can be used on any SQL database.

Monitoring performance by using the Query Store

Find bad performing queries, missing indexes, changed query performance with the Query Store.  More information can be found here:

Monitoring performance by using the Query Store

Monitoring performance by using the SQL Profiler

SQL Profiler can be used to inspect and trace and measure all SQL access. Compared to the Query Store, SQL Profiler provides data that is “less prepared”. However, in some cases that is what’s needed.  Follow these steps:

  1. Start SQL Server Profiler and connect to the Channel database to be profiled
  2. Start a new trace with default configuration (and hit Run)
  3. Rerun the scenario for which you want to profile the SQL access
  4. Stop the trace
  5. In SQL Server Profiler, hit File/Save As/Trace Table and save the trace data to a new table, i.e. into tempdb.ChannelDbTraces
  6. Using SQL Server Management Studio, query the trace table
SELECT [rownumber], 
       [eventclass], 
       Iif(( CONVERT(NVARCHAR(max), [textdata]) LIKE '% [[]ext%' ) 
            OR ( CONVERT(NVARCHAR(max), [textdata]) LIKE '% ext%' ), 'ext', '') 
       AS 
       ExtSchema, 
       [textdata], 
       [cpu], 
       [reads], 
       [writes], 
       [duration], 
       [spid], 
       [starttime], 
       [endtime] 
FROM   [tempdb].[dbo].[channeldbtraces] 
WHERE  loginname = 'axretailruntimeuser' 
       AND duration IS NOT NULL 
       AND ( textdata IS NOT NULL 
             AND CONVERT(NVARCHAR(max), [textdata]) <> 
                 'exec sp_reset_connection' ) 
       AND Iif(( CONVERT(NVARCHAR(max), [textdata]) LIKE '% [[]ext%' ) 
                OR ( CONVERT(NVARCHAR(max), [textdata]) LIKE '% ext%' ), 'ext', 
           '') = 
           'ext' 
ORDER  BY duration DESC    

Useful query scenarios:

  • Longest SQL queries: add order clause “order by Duration desc”. By the way, the Duration columns unit is microseconds.
  • Include only extended SQL queries: add filter clause “and IIF((convert(nvarchar(max), [TextData]) like ‘% [[]ext%’) or (convert(nvarchar(max), [TextData]) like ‘% ext%’), ‘ext’, ”) = ‘ext’” (in 7.2 and later, any custom SQL has to be implemented in the [ext] database schema.)
  • Find any queries that are called multiple times and order by the number of calls, and execution times. This may help to find out if caching mechanisms could be applied to optimize Microsoft or custom code.
    SELECT count(CONVERT(NVARCHAR(max), [textdata])) CountOfExcecutes,
           CONVERT(NVARCHAR(max), [textdata])  as SQLStatement, sum(duration) SUMOfDuration, avg(duration) AVGOfDuration
    FROM   [tempdb].[dbo].[ChannelDbTraces] 
    WHERE  loginname = 'axretailruntimeuser' 
           AND duration IS NOT NULL 
           AND ( textdata IS NOT NULL 
                 AND CONVERT(NVARCHAR(max), [textdata]) <> 
                     'exec sp_reset_connection' ) 
    group by CONVERT(NVARCHAR(max), [textdata])
    order by count(CONVERT(NVARCHAR(max), [textdata])) desc, sum(duration) desc
    

Looking at these SQL traces can reveal issues with inadequate tracing. Some CRT base entities are cached, so you will only see a single call (per RetailServer instance) but if you extend an entity you need to make sure you implement some caching as well if this meets the requirement. For example, fetching an item in the CRT base implementation is cached, so you should only see that call once but if you extended the item with an extension table AND did not use any caching, you will see many calls with the same query during POS operations that require an item lookup. That would indicate that caching should be considered. The caching of a CRT extended entity will be covered in a different blog.

The below trace was taken by adding a single item to a cart (unsorted, so the shown order is the actual execution order). Notice the red marked row. This is the GetItem call of the CRT, and followed the fetch of the item’s extended data. We can clearly see that both of these are only called once, as expected. If this item is being added again within a short period of time, we should not see these SQL traces again.

I can see quite a few similar SQL calls to fetch pricing data, just for adding a single item to a cart. I am not sure why this is, possibly this is something that could be optimized by Microsoft. As a partner/customer, you have full control over the SQL logic in the [ext] schema. Any other issues should be submitted to Microsoft.

Since the data is in format of a SQL table, the data can be easily shared with support or engineers to help with troubleshooting. Simple right click the results header in Management studio/Save Results as/choose CSV file and you are good.

“Looking inside” RetailServer/CRT/SQL with Commerce Runtime Analyzer

This post originally appeared on https://dynamicsnotes.com/looking-inside-retailserver-crt-sql-with-commerce-runtime-analyzer/.

The Retail Product team built a tool that can be used to trace the RetailServer calls, CRT executes, and SQL calls. It shows call-stack like information based on event traces, similarly to the Dynamics 365 Trace Parser. The tool can be used to find slow handlers, slow SQL or just understand what is happening as part of a call.

As usual, a picture says more than 100 words. See my investigation of slow performance of the UpdateCartLines RetailServer call. From that call stack, I can learn this flow includes a lot of other internal steps: get identity, get cart, get products, get unit of measures, calculate reason codes, calculate prices tax, calculate discounts, calculate sales tax, calculate totals, save versioned cart, final saving of the transaction in SQL and much more. This is VERY valuable information and can be obtained with the Commerce Runtime Analyzer WITHOUT reflecting the source code.


I notice that the CalculateCartRequiredReasonCodesServiceRequest takes 2021 ms. When I add up the included child timings, there is a full 2s missing. This is in my own customization (for this sample, I have added a 2s delay in an extended handler).

Another scenario is to find out what data the CRT logic is using. I ran a product search and the tool lets me know that the data for the 62 result rows comes from [crt].[GetProductsSearchResultsByText_V2].

The tool is not perfect. At this time, it does not seem to show custom handlers properly. If the Retail team gets enough “requests”, I am sure this could be an easy addition made.

In order to use this tool follow the steps:

1. Ask me for a link of to CommercePerfAnalyzer.zip
2. Unzip and execute the CommercePerfAnalyzer.exe
3. Exercise your scenario
4. Wait a few seconds
5. Inspect the output of the tool

Simulating network “issues”

This post originally appeared on https://dynamicsnotes.com/simulating-network-issues/.

In some cases it is very useful to see how a web site would perform under certain network conditions that are worse than what you have currently. You can use this tool to simulate it: https://jagt.github.io/clumsy/. As an example, if you want to simulate what a network latency of 200ms looks like while using POS, run it on the same computer as POS and configure it with 200ms outbound.

Even if you are on a good network, with this tool you can evaluate what it would look like for someone with higher latency (or other network conditions).

RetailServer API timings as seen from POS

This post originally appeared on https://dynamicsnotes.com/retailserver-api-timings-as-seen-from-pos/.

There may be some APIs that “appear” slower than others. To find out, just hit F12 if you are running in the browser or ModernPOS to launch the tool (ModernPOS may require to enable developer mode in Windows).

Running the CloudPOS logon sequence on the same computer that I measured the latency above from, I get these timings:

As you can see, the quickest API calls are all around 60 ms, which makes sense as our measurements above showed an always occurring latency of 41ms.

Depending which scenario is slow, focus on these and see what exact RetailServer call(s) are the culprits. Then move on to the next step to find out why.

By the way, I am not too worried about the time a login takes, as it is usually not a very frequent operation. This may be different for some customers that configure a logoff after each transaction or after a certain time. In general, I would focus on the top 5 customer scenarios.

Latency between POS and RetailServer

This post originally appeared on https://dynamicsnotes.com/latency-between-pos-and-retailserver/.

There is always going to be a physical separation between the server (RetailServer) and client (ModernPOS or CloudPOS browser instance).  If this physical distance is large, every RetailServer call will incur a larger additional latency. There is no code change that can fix this, a redeployment of cloud or client components will be needed to lower the value.

Here is how to measure the latency.

  1. Find out what Azure data center the RetailServer is hosted. Use LCS environment page for the specific environment or ask your IT administrator. For example, my RetailServer is hosted on the Azure primary region “West Central US”.
  2. On the same computer as your store terminal open an internet browser window and browse to http://www.azurespeed.com/. Check at correct Azure region or a few on the same area. The web page will tell you the latency from your computer to the data center the RetailServer is hosted. It is very important to use the same computer as the store terminal, as sometimes customers use a dedicated network for the store terminals and a computer in the back office may be on a different network.

In my example, you can see I get a latency of about 41 ms (for every RetailServer call).  That is a very good value (for this particular single store, it may have been better to use “West US 2” to get an even better response). Off course the choice should be balanced between all different stores that use this RetailServer instance.

If you want to further investigate where a latency issue occurs, you may use other networking utilities. For example tracert (http://www.mediacollege.com/internet/troubleshooter/traceroute.html). It will list all the routers it passes through until it reaches its destination, or fails to and is discarded. In addition to this, it will tell you how long each ‘hop’ from router to router takes.

Note that Azure does not seem to allow ICMP packets through, but tracert and ping can still be used to get a sense of what the issues are outside of the data center.