Overview
Operations Insights for the Commerce is now generally available and provides a wealth of telemetric information. After enabling and configuring it, every RetailServer API call and SQL query is being logged to the customer’s Azure Application Insights, no matter whether it is coming from out-of-box or extension code. The extend of the information is comparable with what is available to Microsoft’s product and support teams, including the execution time of these operations in milliseconds. This proves to be a treasure trove of information for customers and implementation partners to understand better what is happening inside the CSU. Azure provides different tools to “look” into this data which are based on the Kusto query language ((TODO: add link)). These are well documented.
While querying the data yourself proves useful for many cases, it is lacking a high-level view. While working on a Commerce implementation project recently, I have build a Azure’s data explorer dashboard to provide this high-level view. After receiving great feedback from my team and since it took a few iterations to get the Kusto queries right, I have been able to “re-create” the dashboard for another Commerce implementation in under 15 minutes. I am providing a step-by-step manual on how do do that so other’s can use it in their implementations as well.
See a screen shot of the dashboard below:
(TODO: add link)
If you have any feedback, corrections or additional implementation ideas please let me know.
Note: Only CSU telemetry is currently supported, but POS, HardwareStation and even the Dynamics 365 Finance and SCM traces are planned for the future.
Creation
First, enable Operations Insights in F&SCM and verify that the telemetry data is flowing (ToDO add link).
Add the cluster
Go to https://dataexplorer.azure.com/clusters/ and select Add Cluster. Then configure the dialog as below:
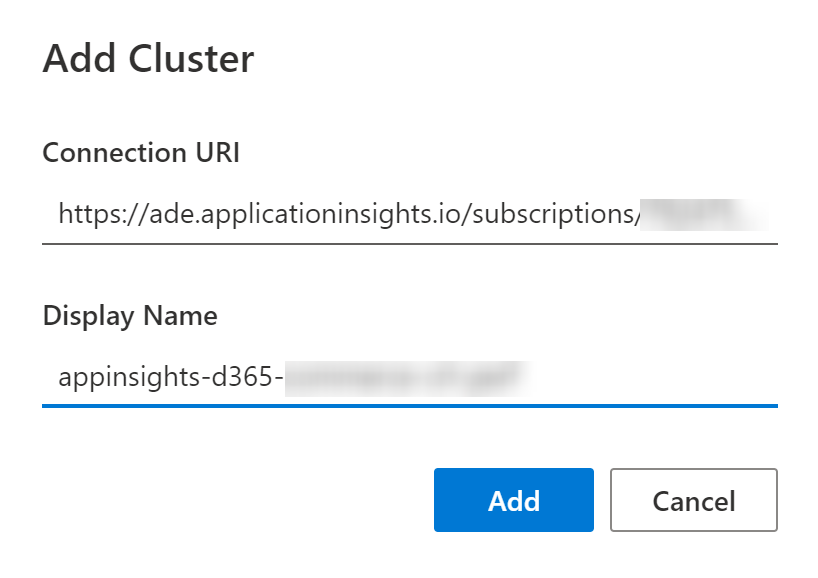
The connection URI should have the following format:
https://ade.loganalyticshttps://ade.applicationinsights.io/subscriptions/<subscription-id>/resourcegroups/<resource-group-name>/providers/microsoft.insights/components/<application-insights-name>
Note that the above URI needs to be edited for correct subscription Id, resource group name and application insights names.
Add the dashboard and data source
- Create a new Azure Data Explorer dashboard at (todo add link……….. https://dataexplorer.azure.com/dashboards)
- Add a new dashboard at https://dataexplorer.azure.com/dashboards
- On the new dashboard, click the top right down-caret, pick Data Sources and click Create new data source
- Enter the same URI that you used for the cluster above, and give it a prescriptive name. Note: Make sure the URI is proper, copying and pasting in this dialog is a little difficult
- Click Connect and select the data source. If it did not find the data source, the URI is incorrect.
- Save the dashboard before continuing.
Create the [@] Parameters
- Click the [@] Parameters link
- A “Time range” parameter will already be pre-configured, and we will keep it as is
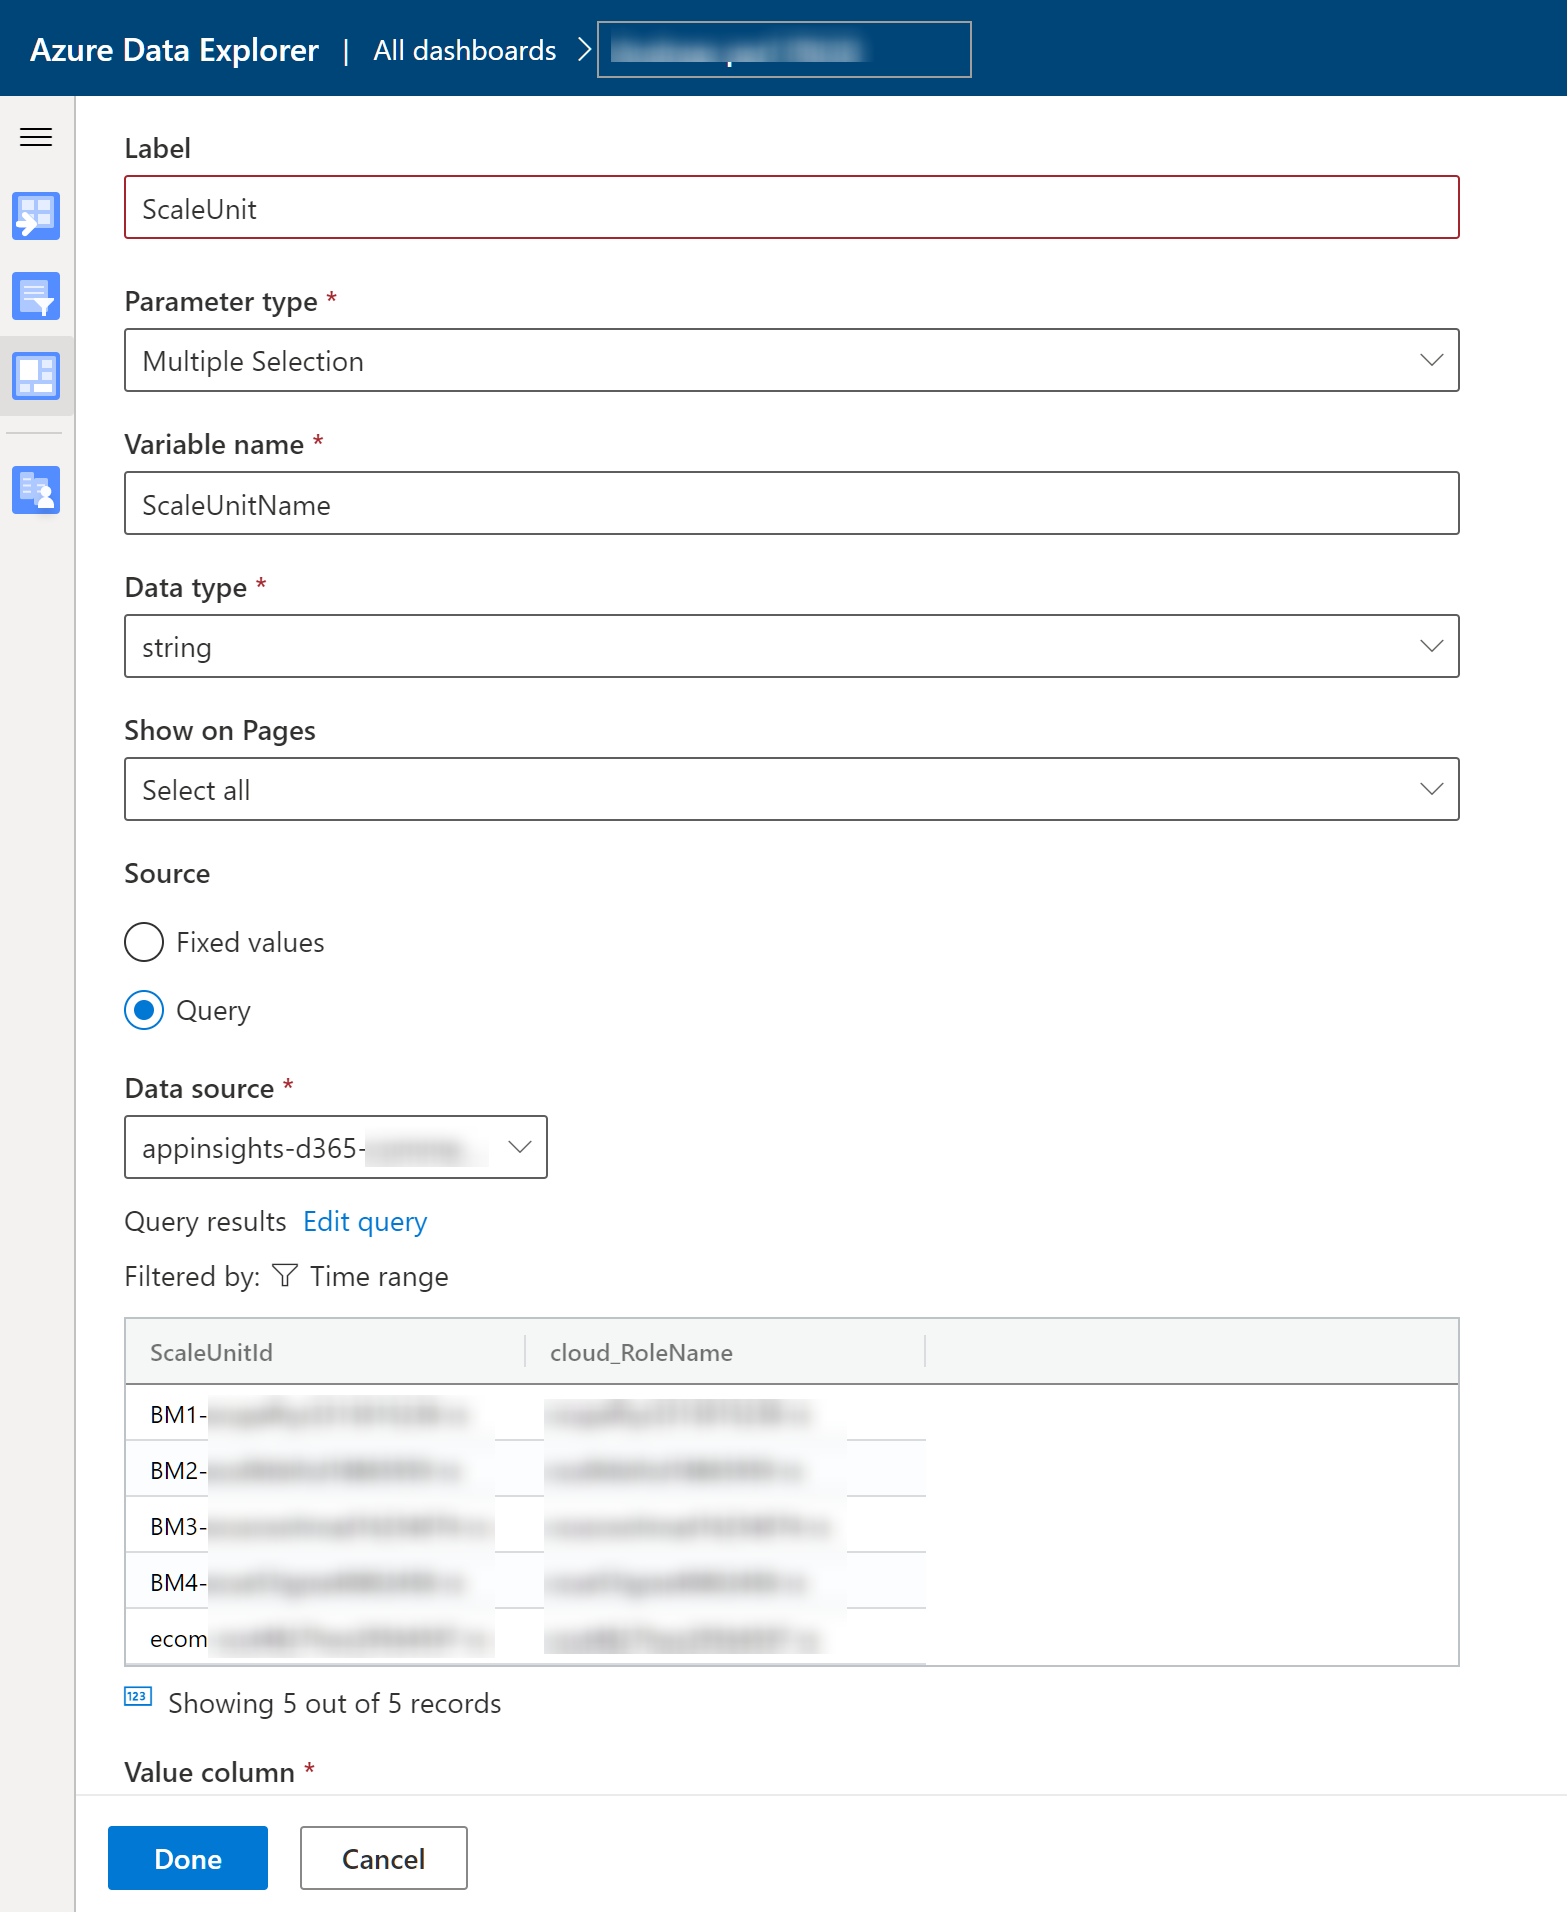
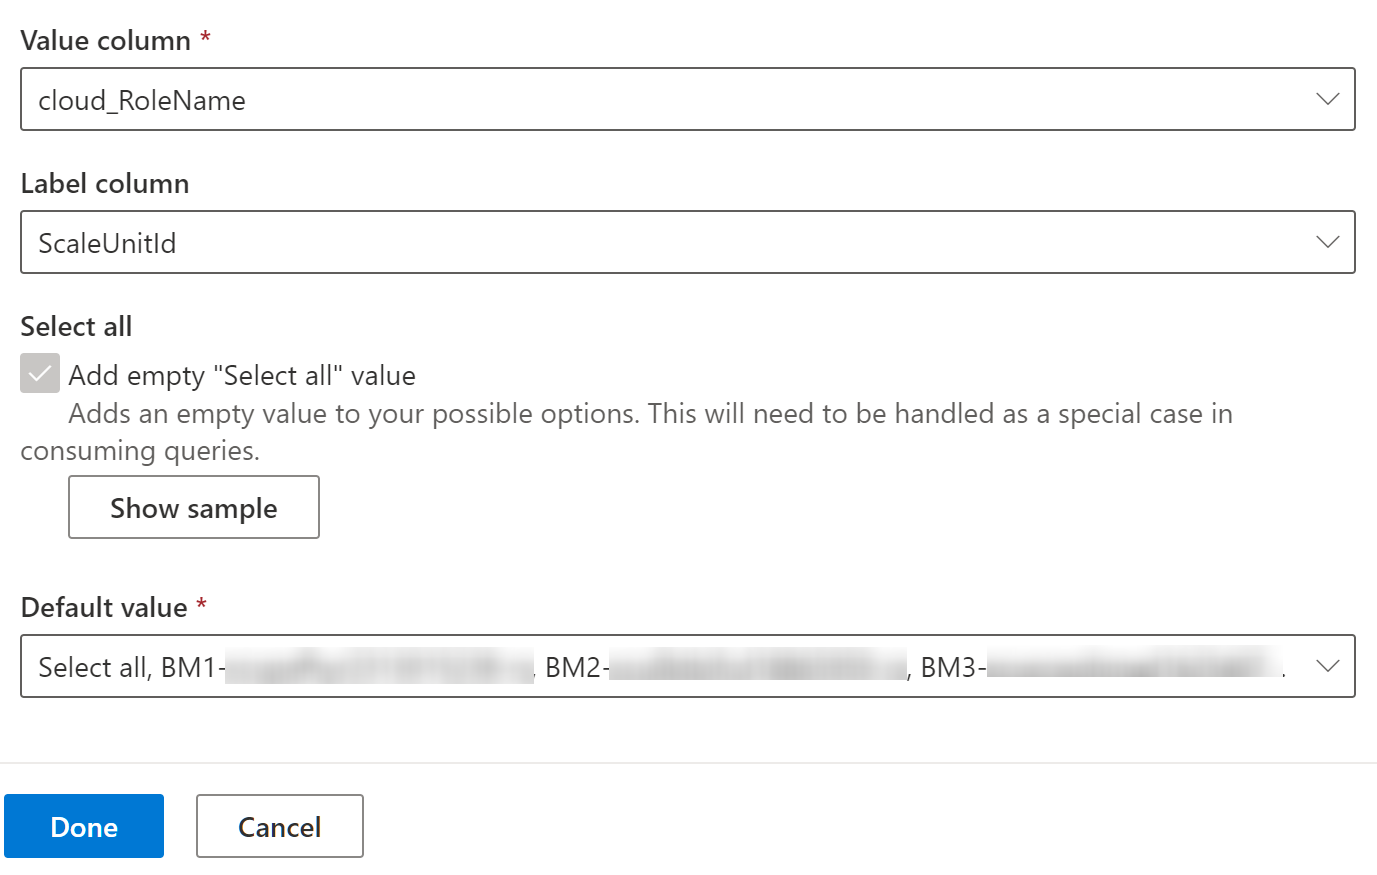
- Create a new parameter “ScaleUnit”. See details below
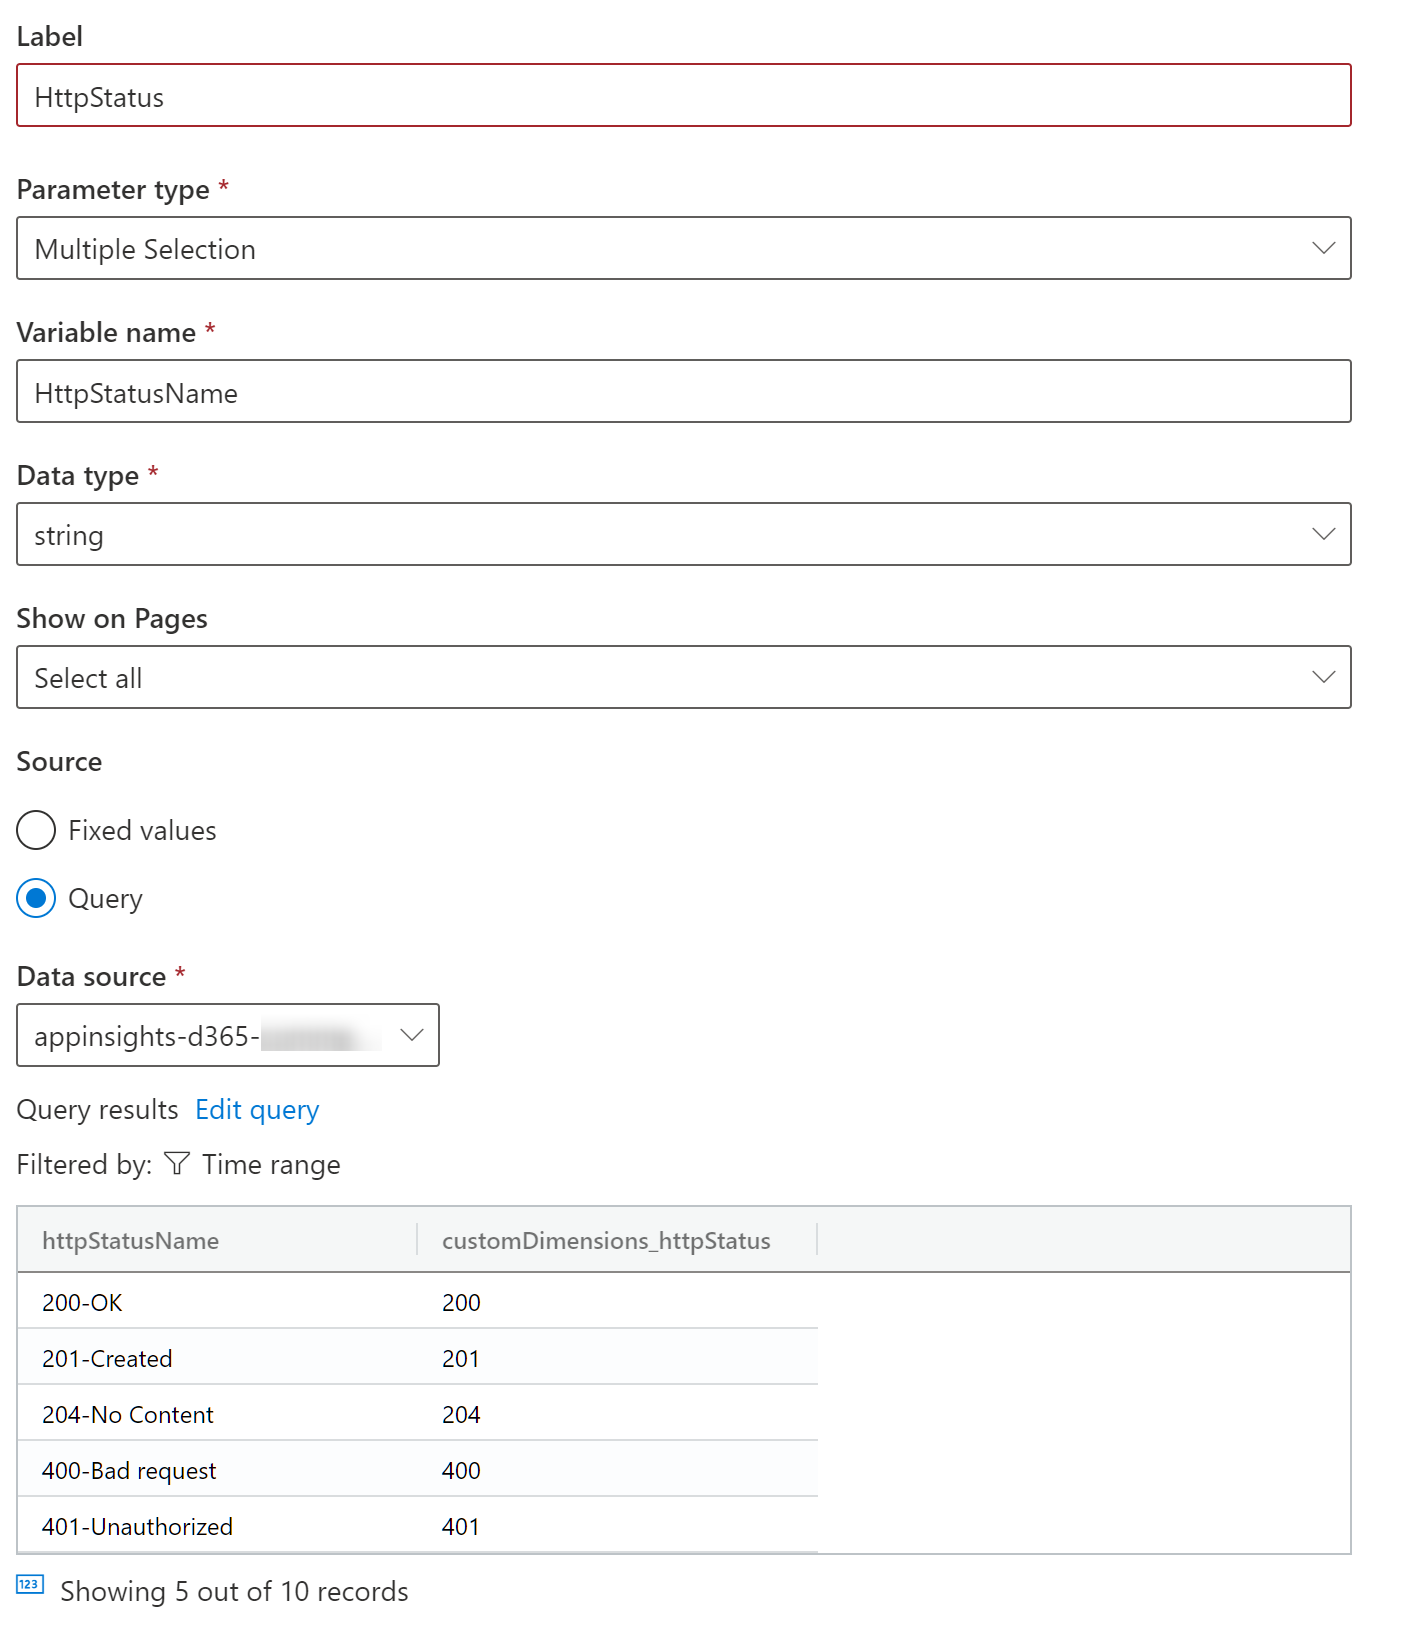
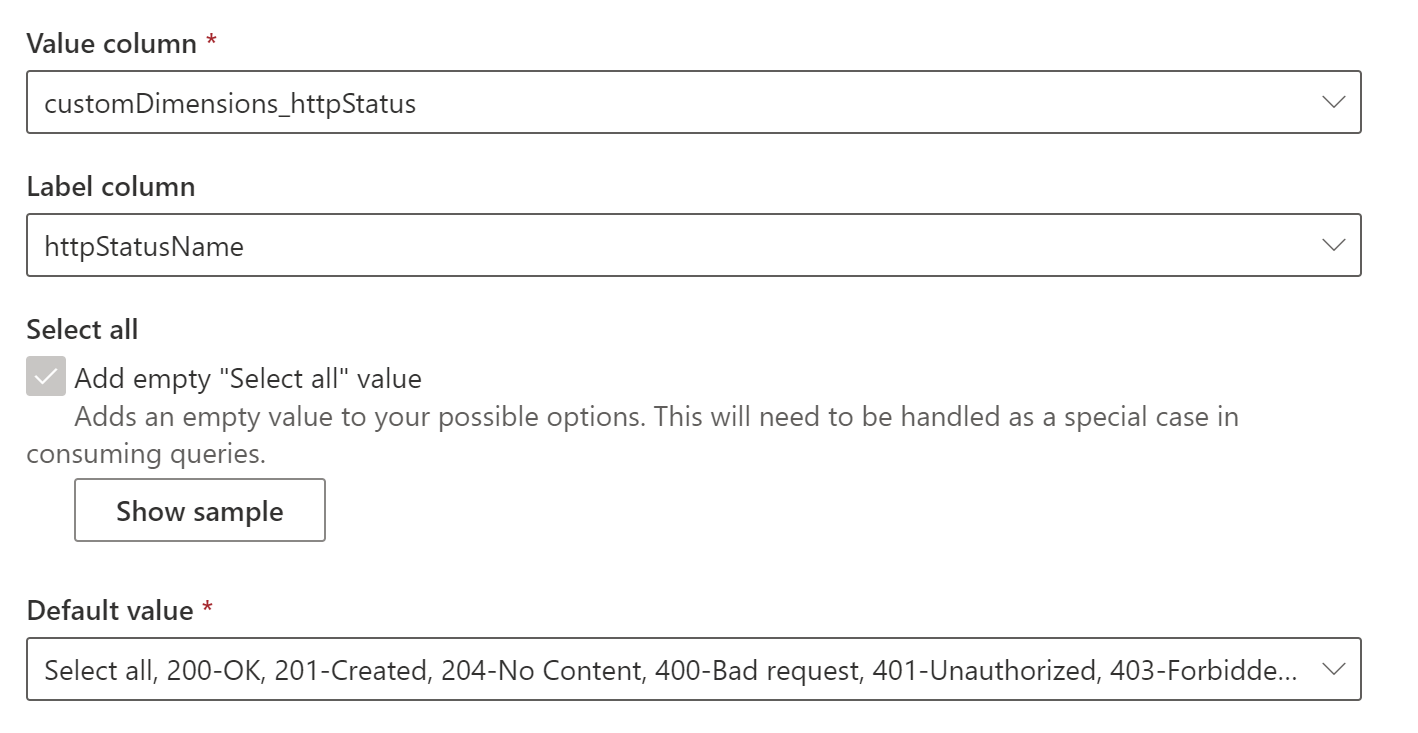
- Create a new parameter “HttpStatus”. See details below
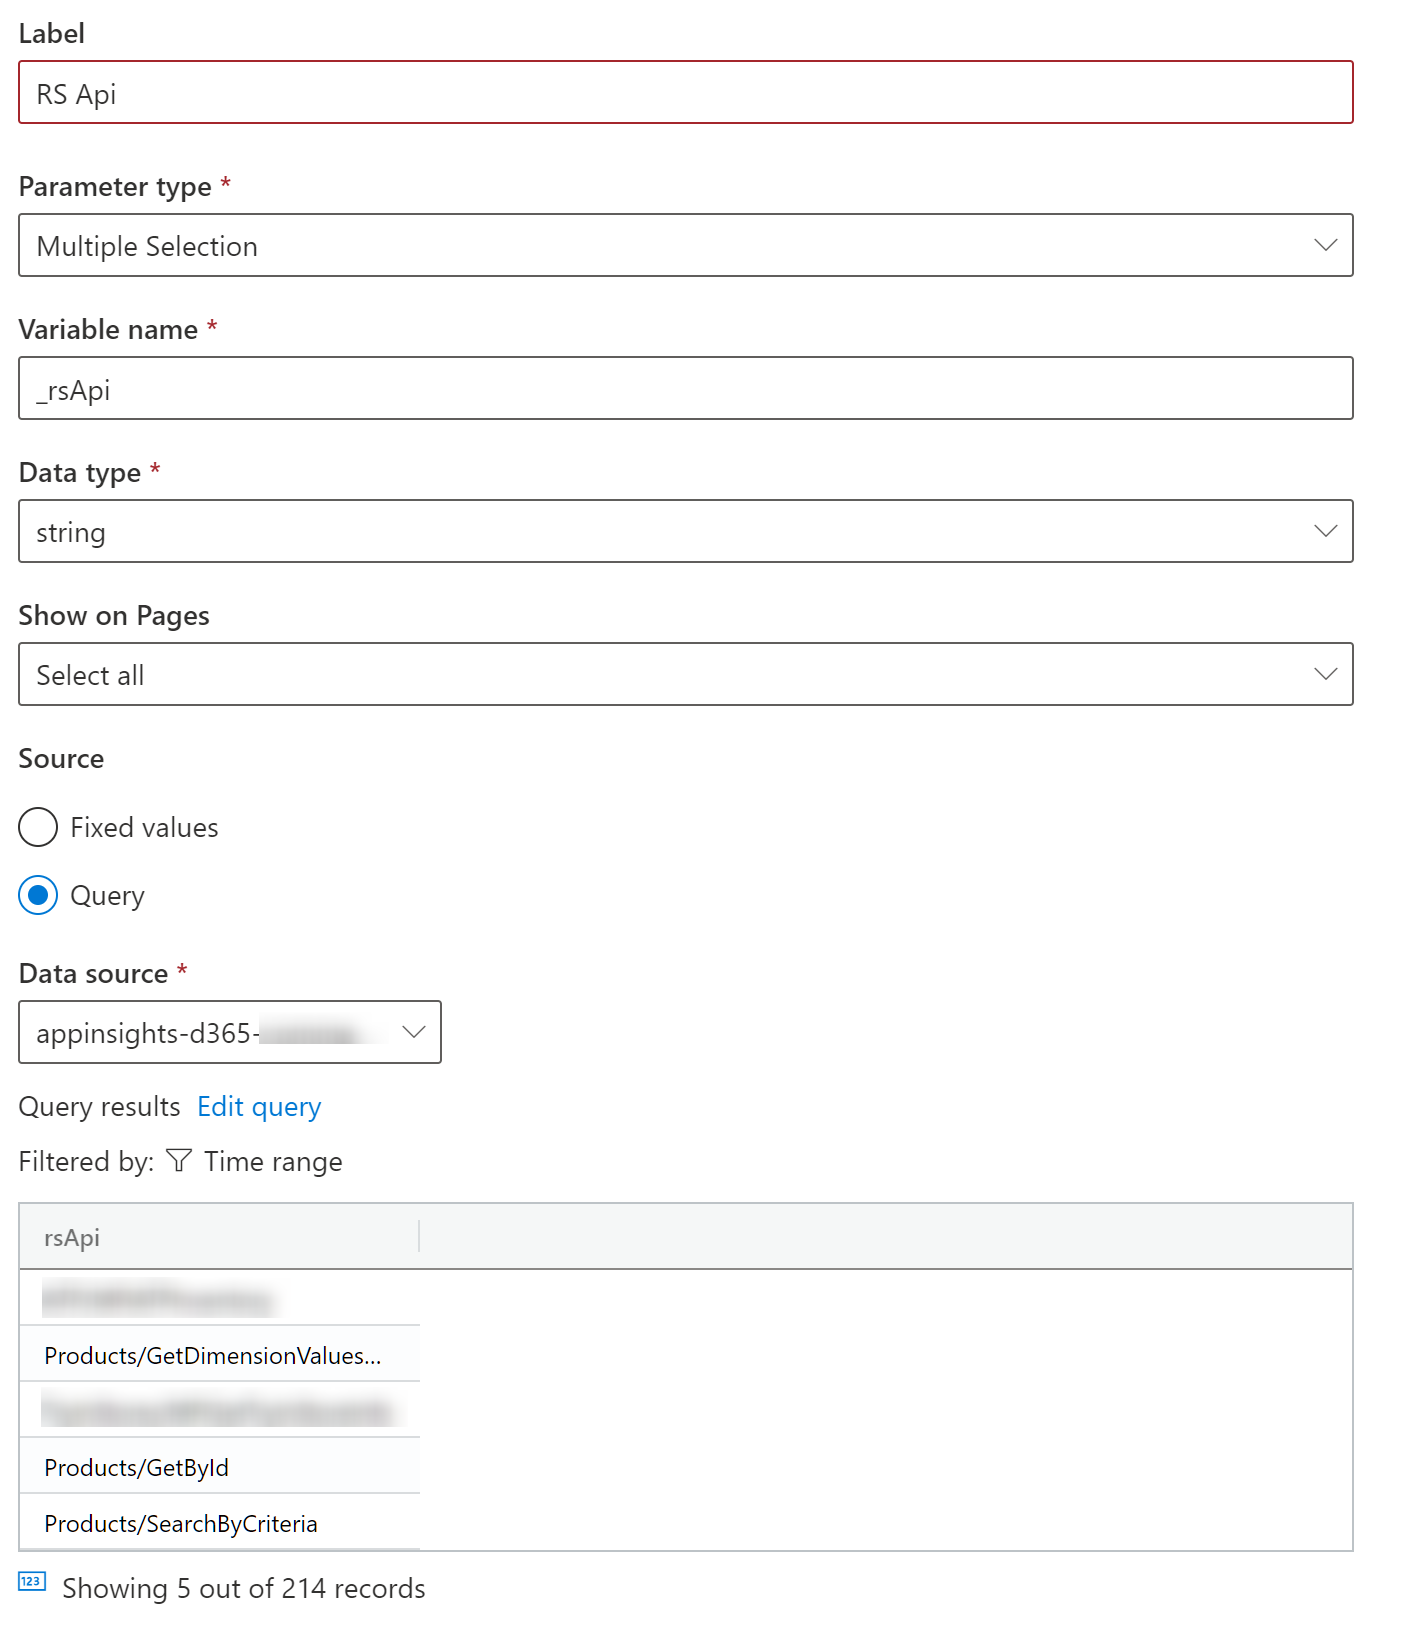
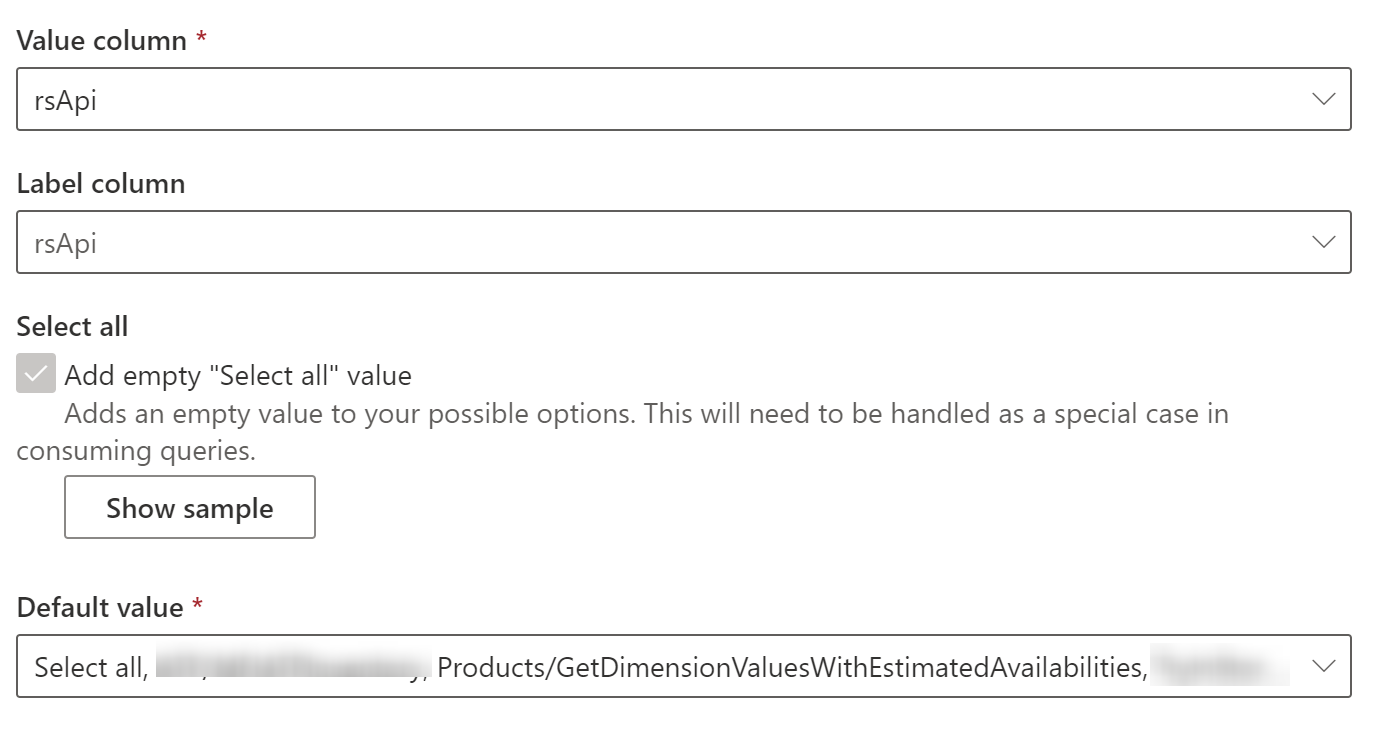
- Create a new parameter “RS Api” as below
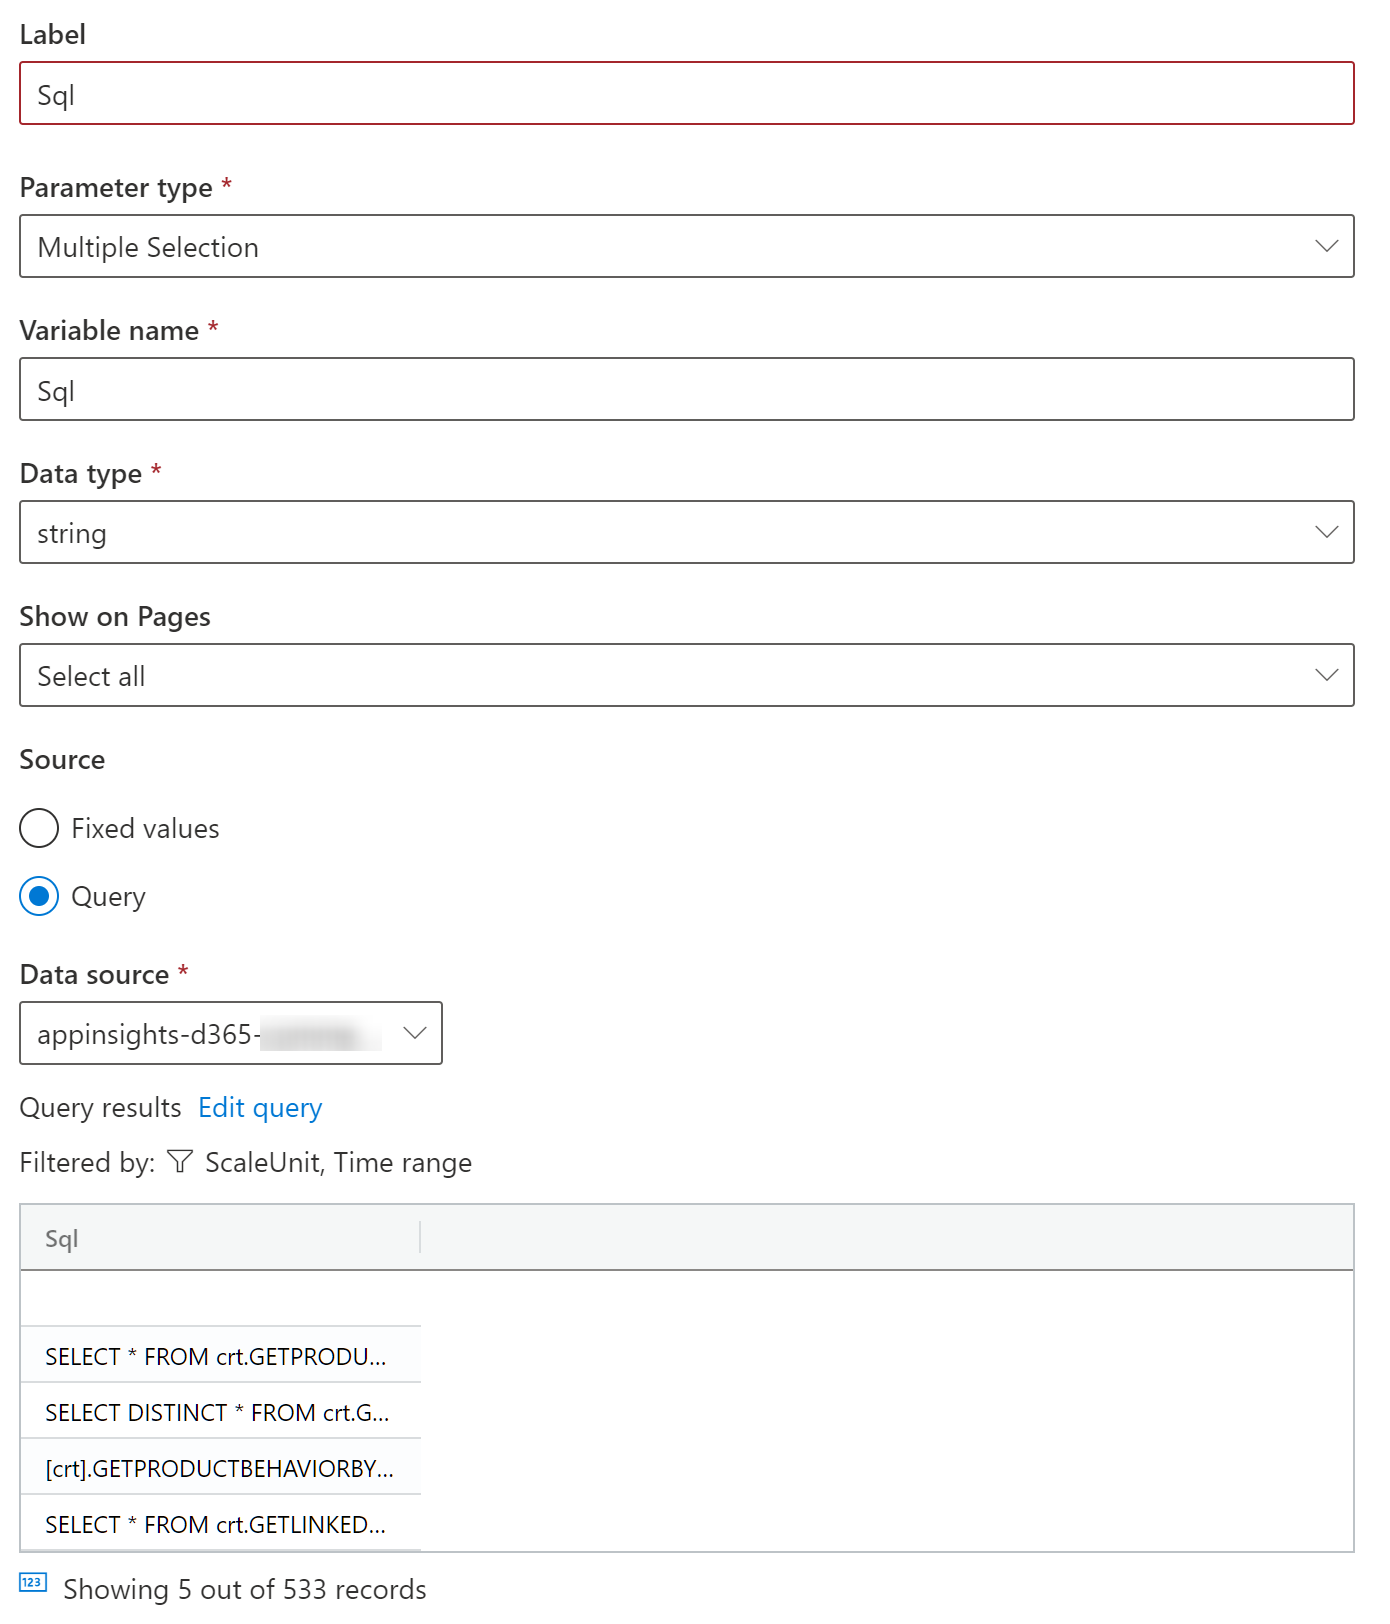
- Create a new “Sql” parameter as below

At this point, we are done with the parameters. The dashboard should show these new query parameters:
