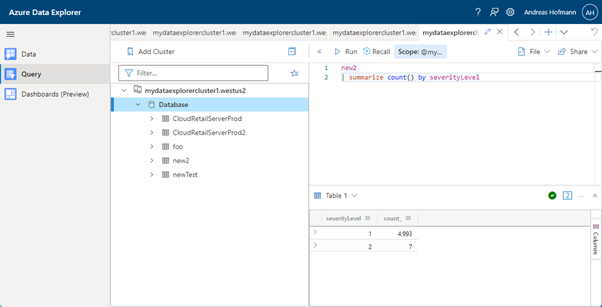
Operations Insights for the Commerce is now generally available and provides a wealth of telemetric information. After enabling and configuring it, every RetailServer API call and SQL query is being logged to the customer’s Azure Application Insights, no matter whether it is coming from out-of-box or extension code. The extend of the information is comparable with what is available to Microsoft’s product and support teams, including the execution time of these operations in milliseconds. This proves to be a treasure trove of information for customers and implementation partners to understand better what is happening inside the CSU. Azure provides different tools to “look” into this data which are based on the Kusto query language ((TODO: add link)). These are well documented.
While querying the data yourself proves useful for many cases, it is lacking a high-level view. While working on a Commerce implementation project recently, I have build a Azure’s data explorer dashboard to provide this high-level view. After receiving great feedback from my team and since it took a few iterations to get the Kusto queries right, I have been able to “re-create” the dashboard for another Commerce implementation in under 15 minutes. I am providing a step-by-step manual on how do do that so other’s can use it in their implementations as well.
See a screen shot of the dashboard below: (TODO: add link)
If you have any feedback, corrections or additional implementation ideas please let me know.
Note: Only CSU telemetry is currently supported, but POS, HardwareStation and even the Dynamics 365 Finance and SCM traces are planned for the future.
Creation
First, enable Operations Insights in F&SCM and verify that the telemetry data is flowing (ToDO add link).
Add the cluster
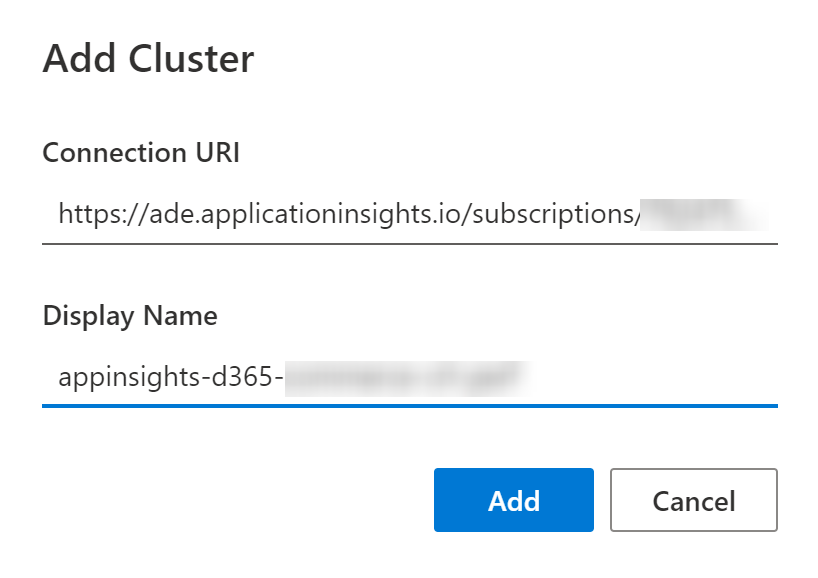
Go to https://dataexplorer.azure.com/clusters/ and select Add Cluster. Then configure the dialog as below:
The connection URI should have the following format:
Note that the above URI needs to be edited for correct subscription Id, resource group name and application insights names.
Add the dashboard and data source
Create a new Azure Data Explorer dashboard at (todo add link……….. https://dataexplorer.azure.com/dashboards)
Add a new dashboard at https://dataexplorer.azure.com/dashboards
On the new dashboard, click the top right down-caret, pick Data Sources and click Create new data source
Enter the same URI that you used for the cluster above, and give it a prescriptive name. Note: Make sure the URI is proper, copying and pasting in this dialog is a little difficult
Click Connect and select the data source. If it did not find the data source, the URI is incorrect.
Save the dashboard before continuing.
Create the [@] Parameters
Click the [@] Parameters link
A “Time range” parameter will already be pre-configured, and we will keep it as is
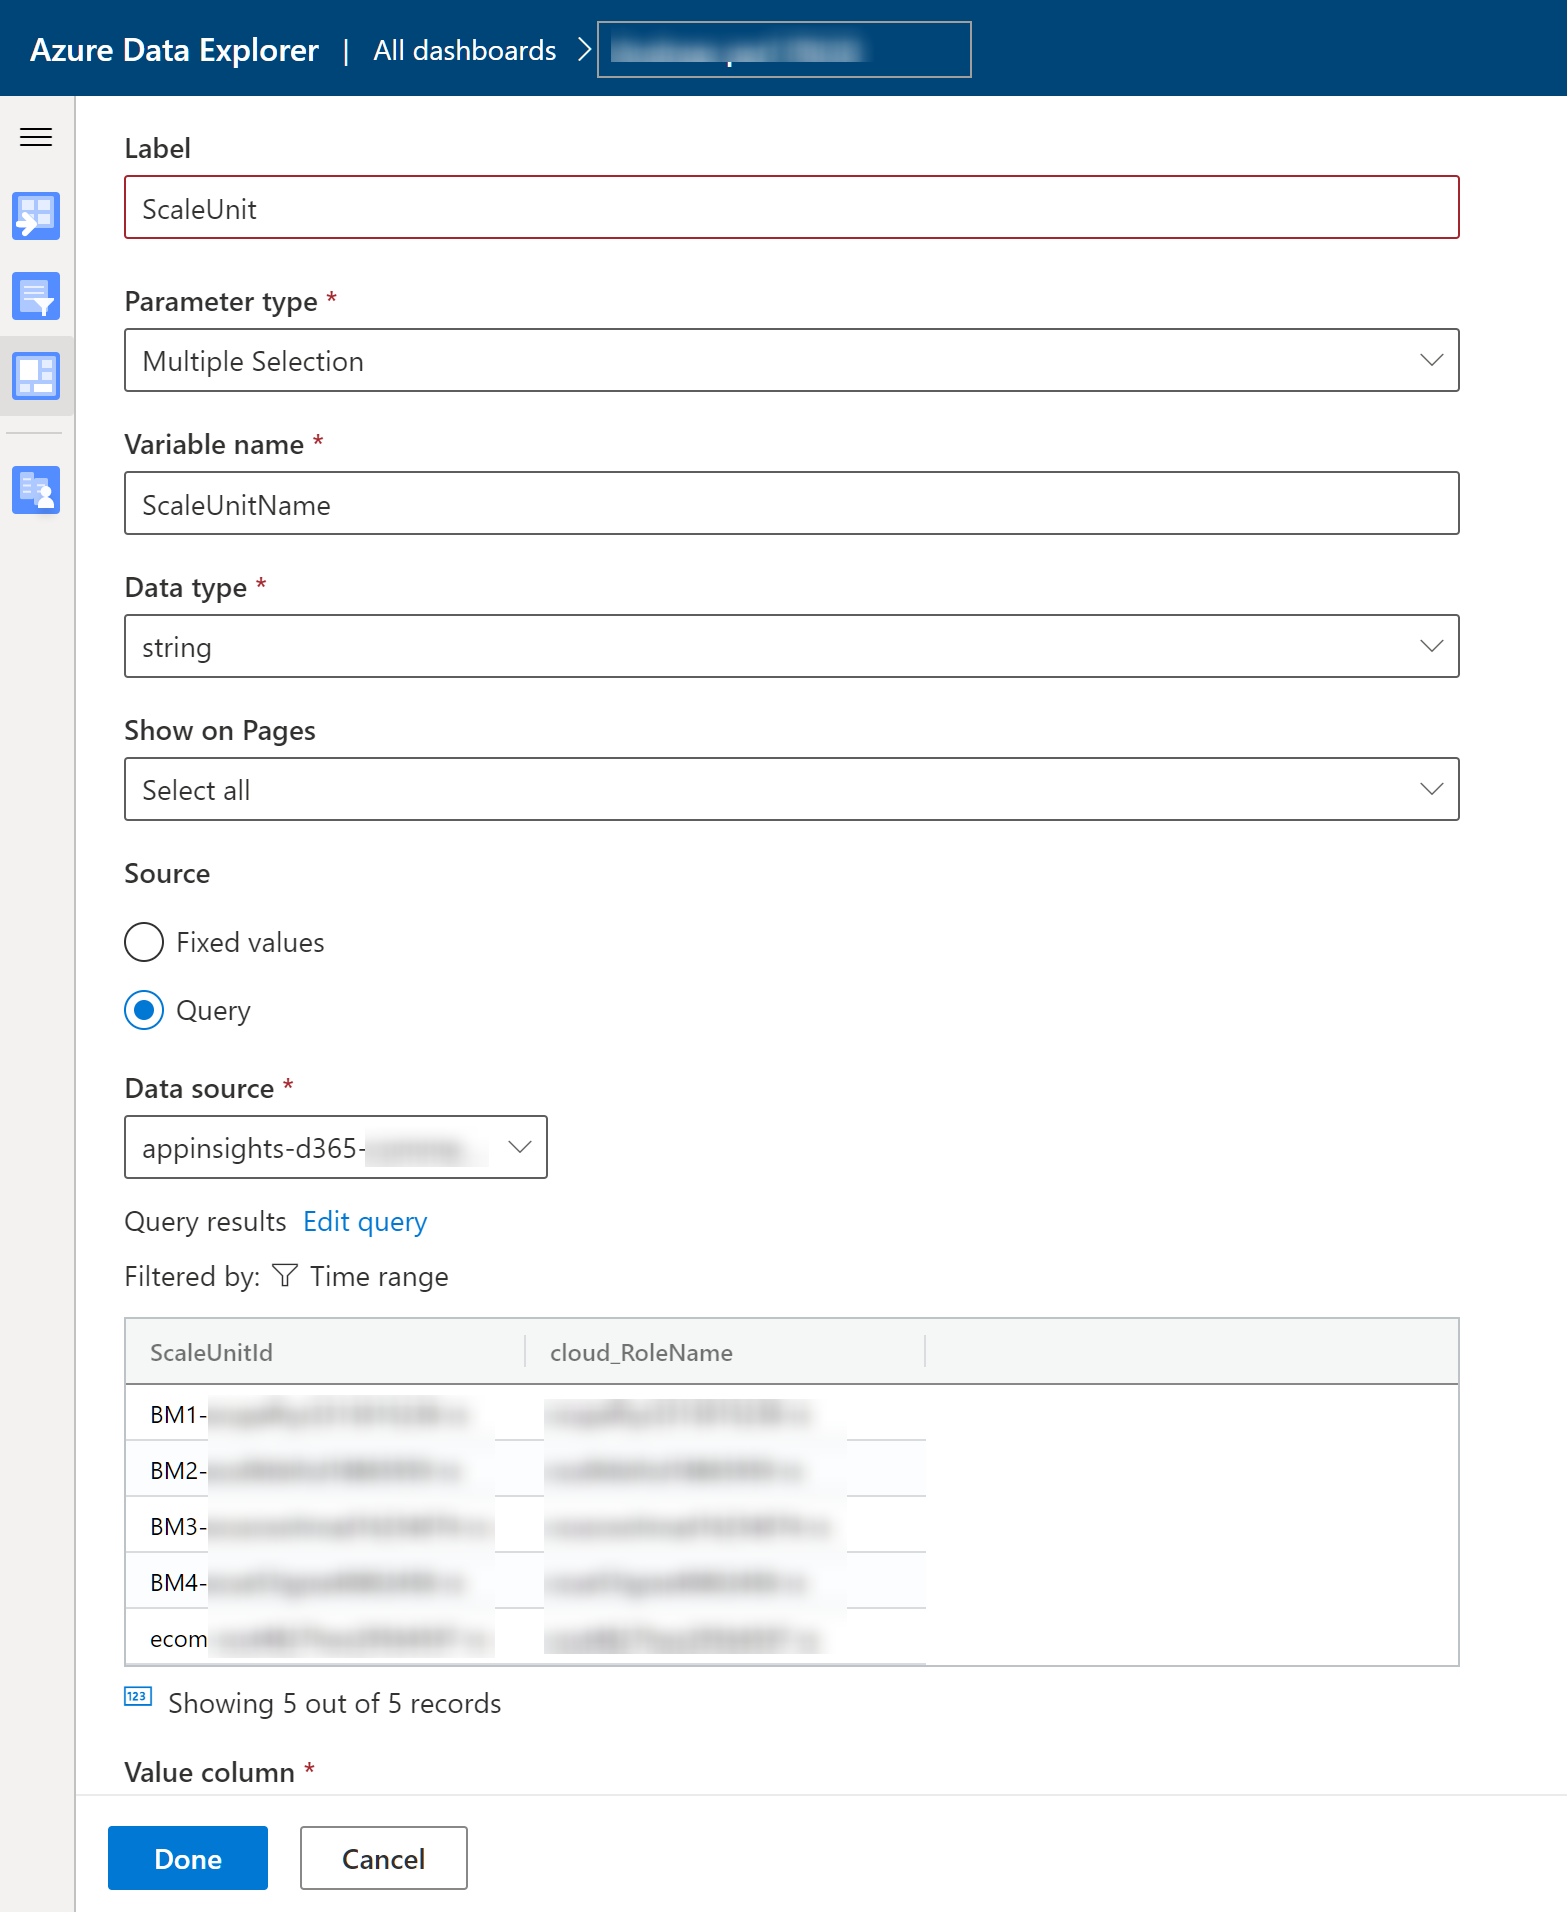
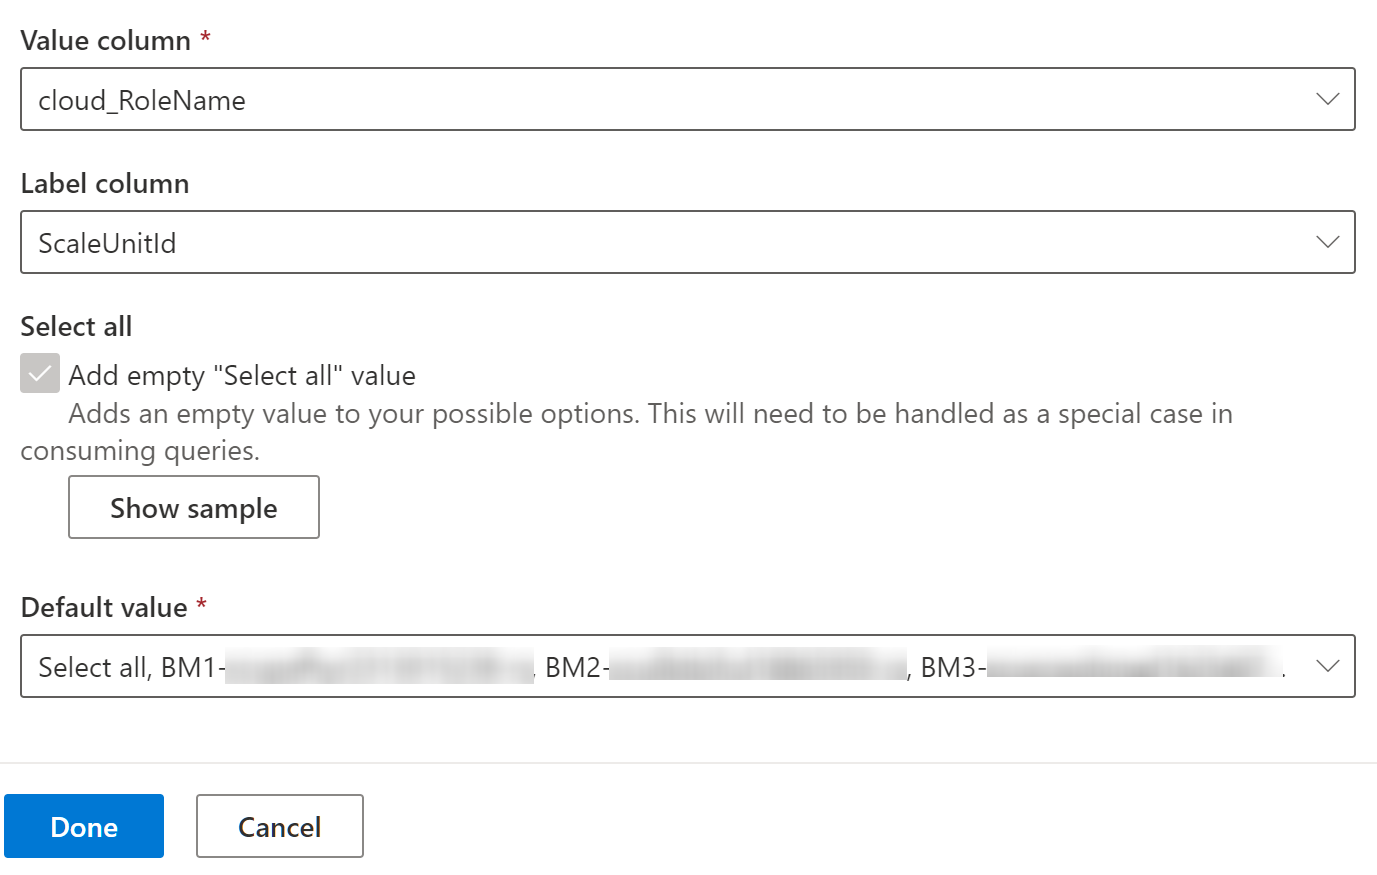
Create a new parameter “ScaleUnit”. See details below
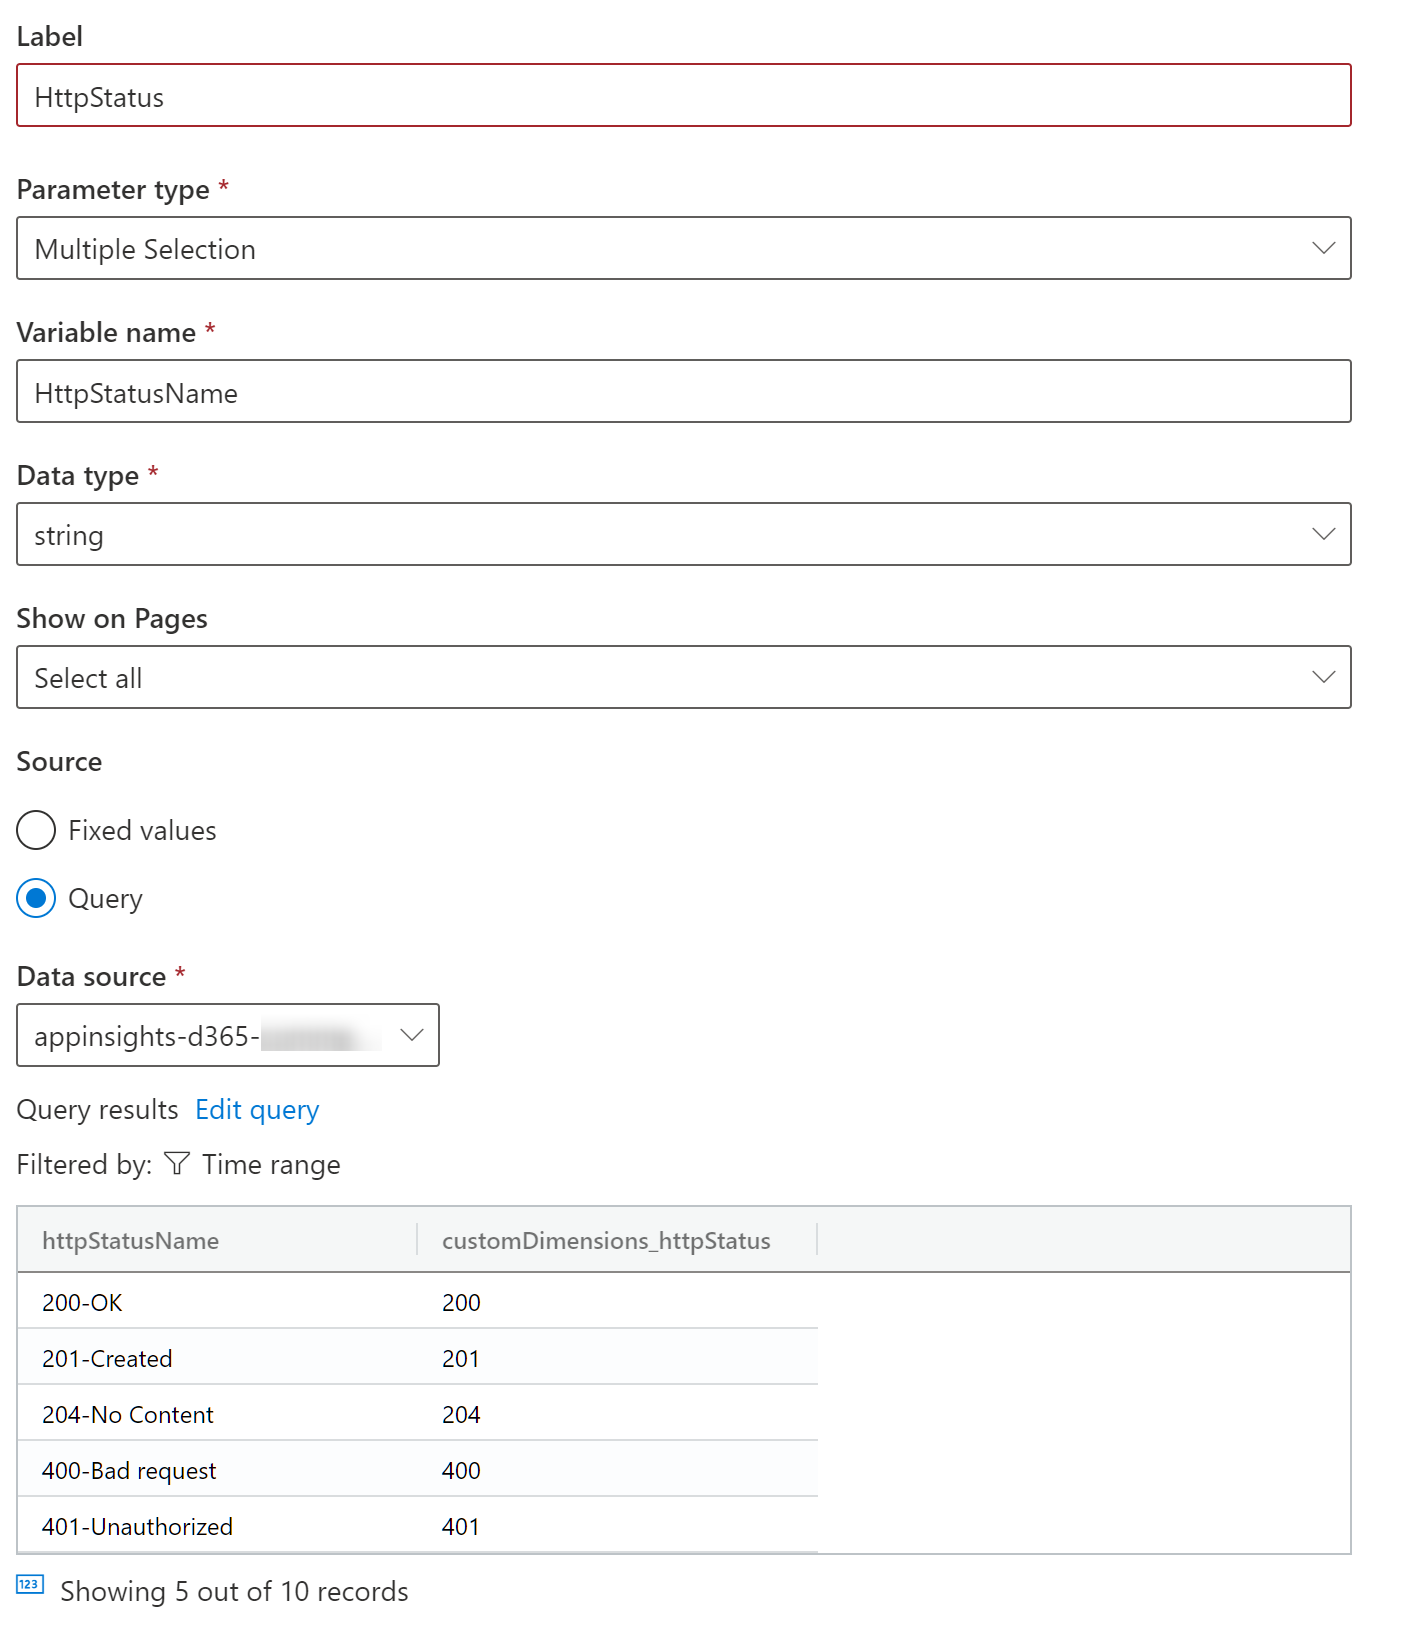
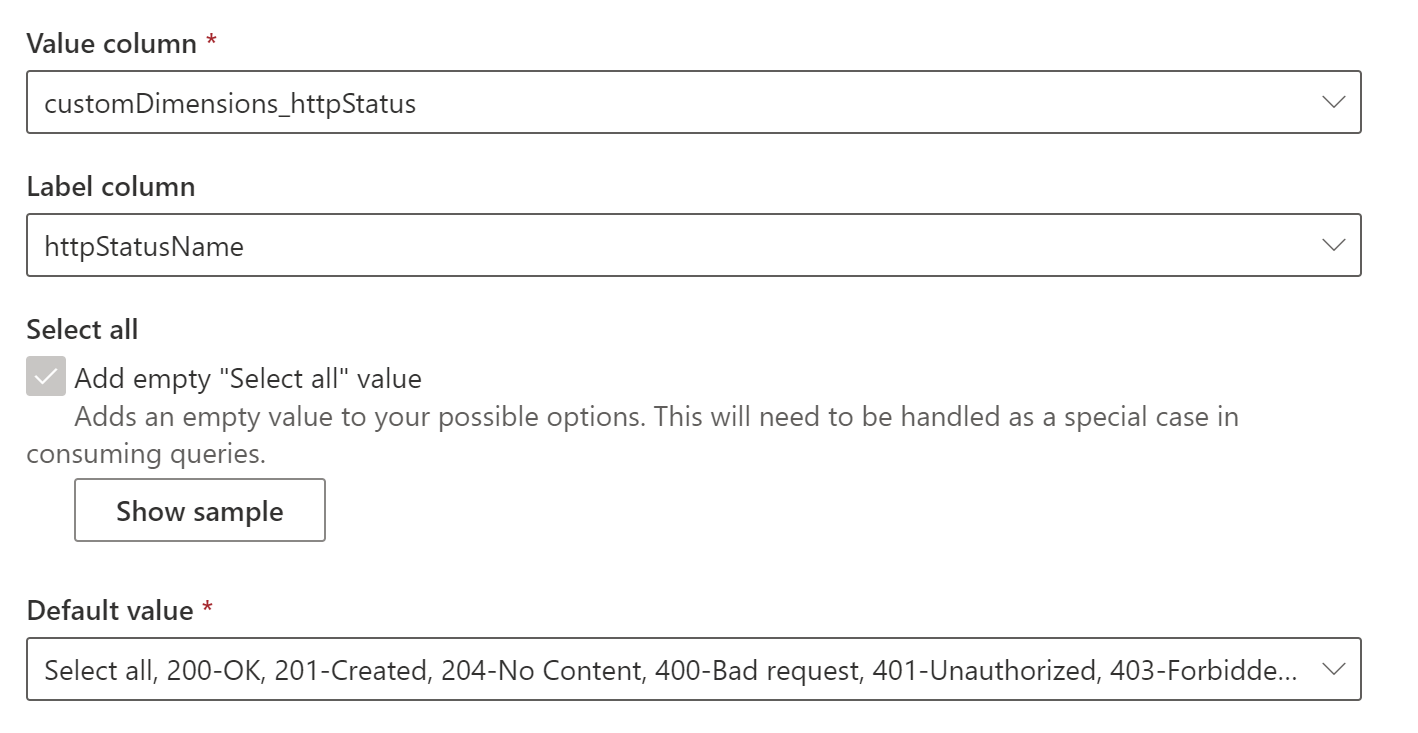
Create a new parameter “HttpStatus”. See details below
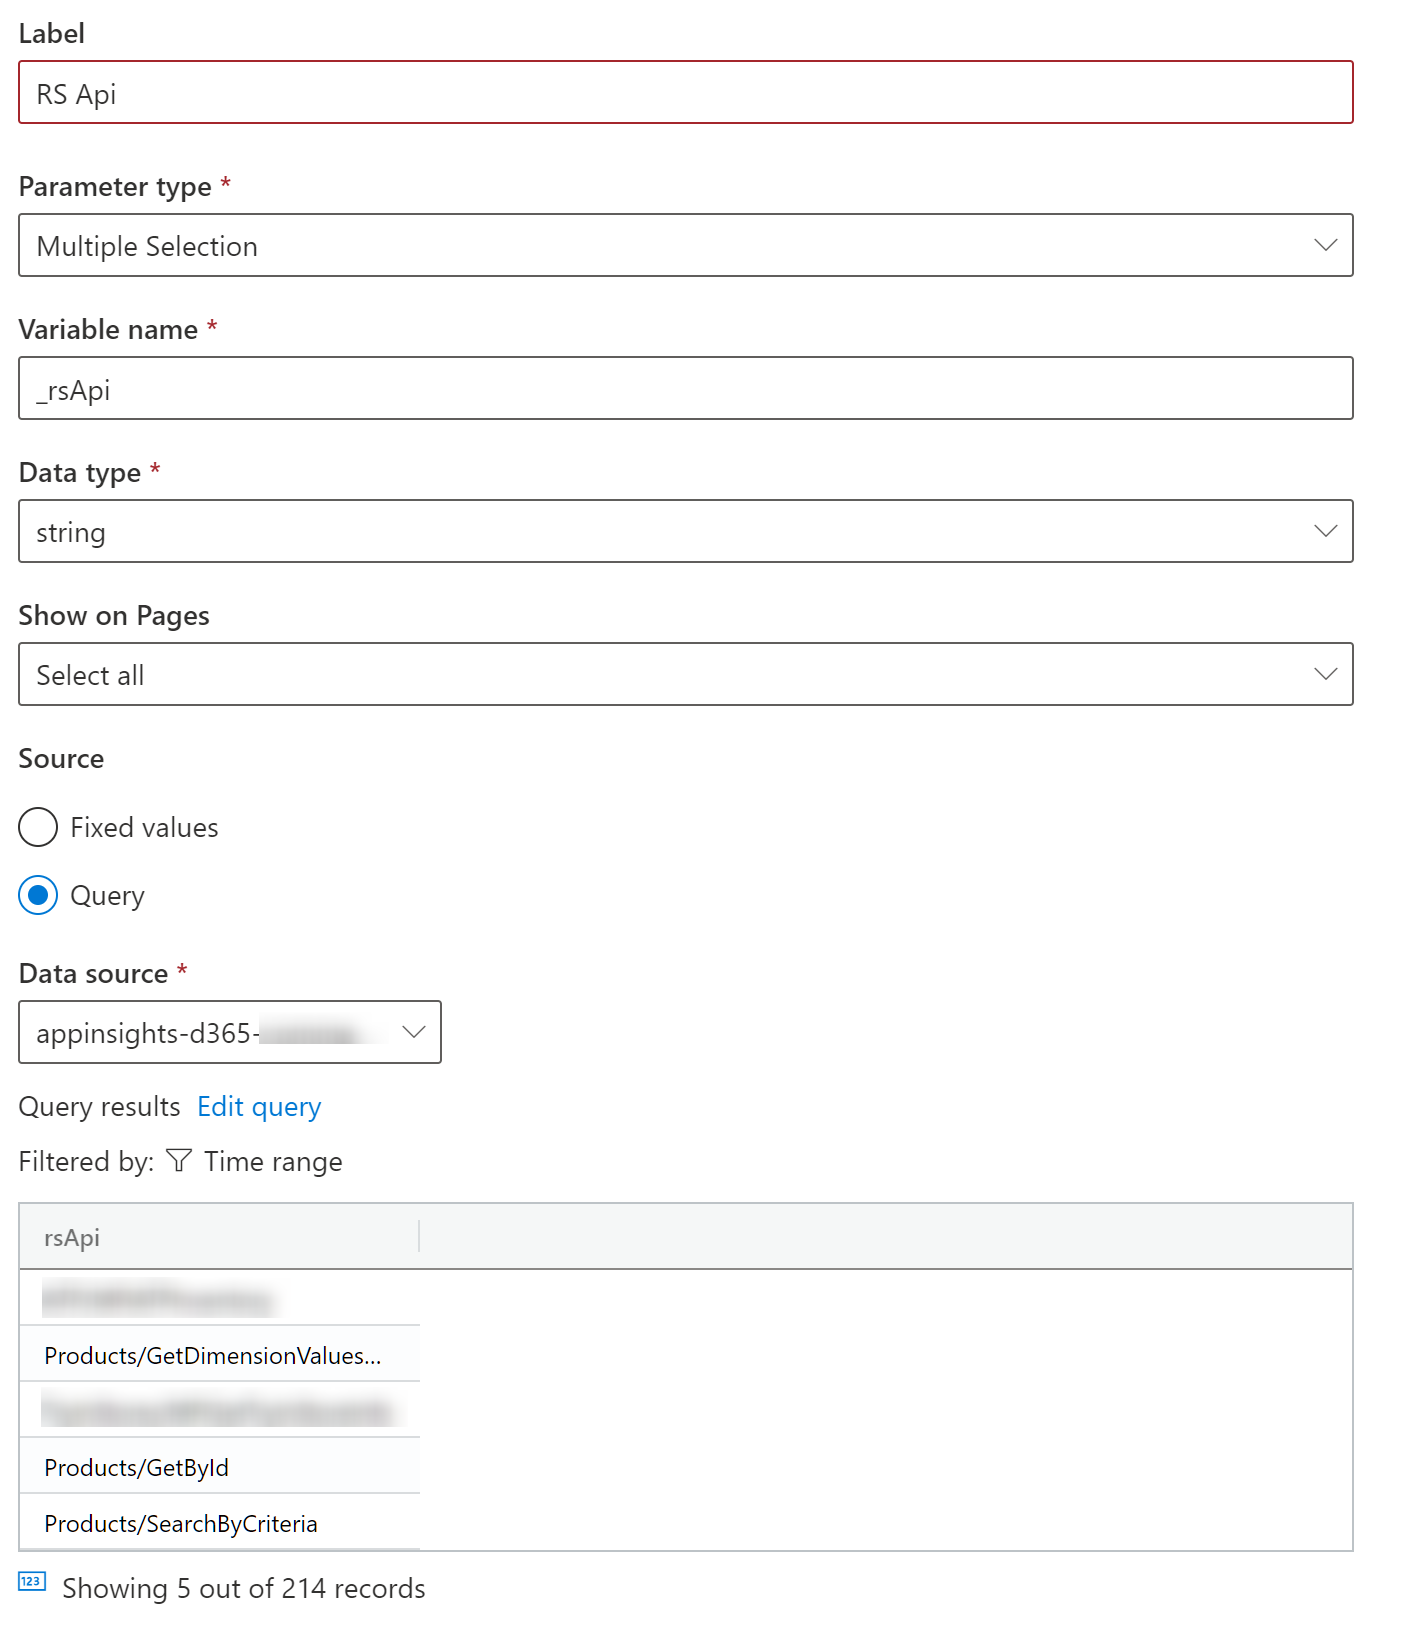
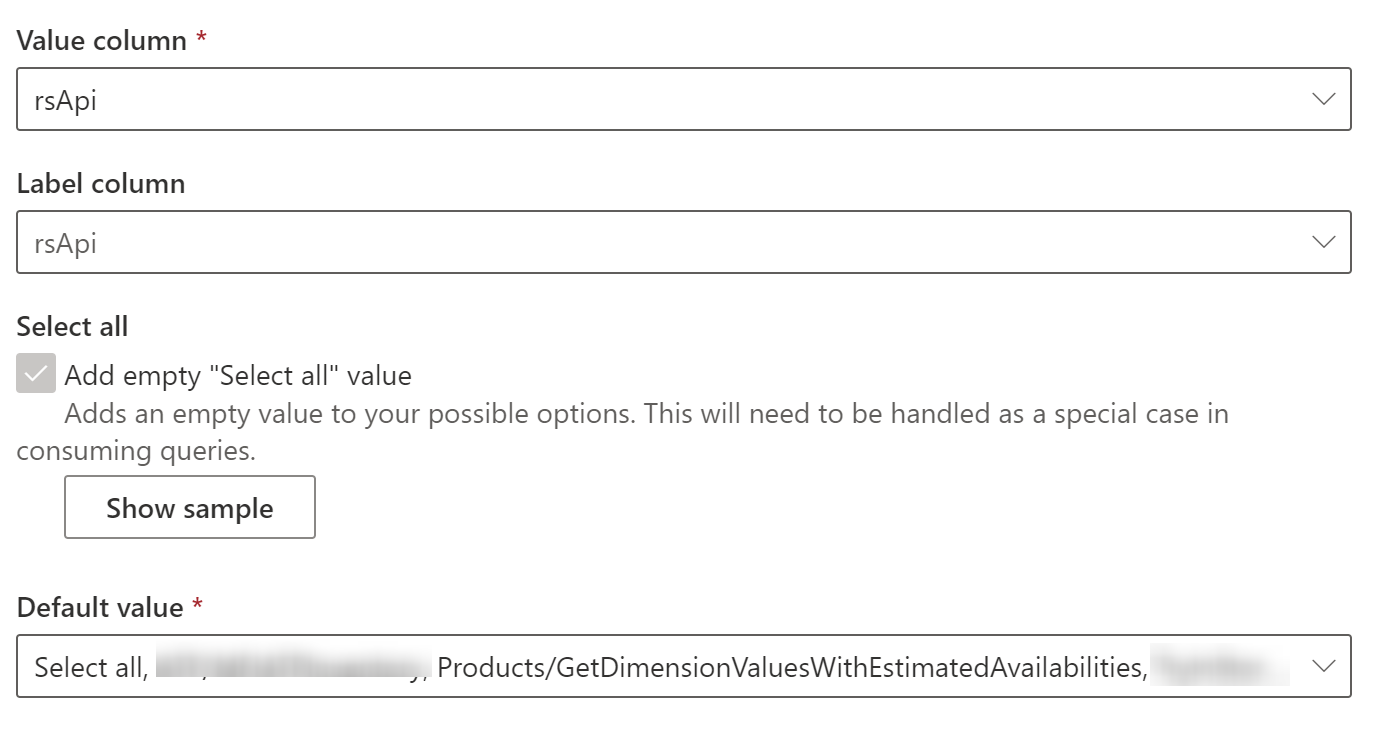
Create a new parameter “RS Api” as below
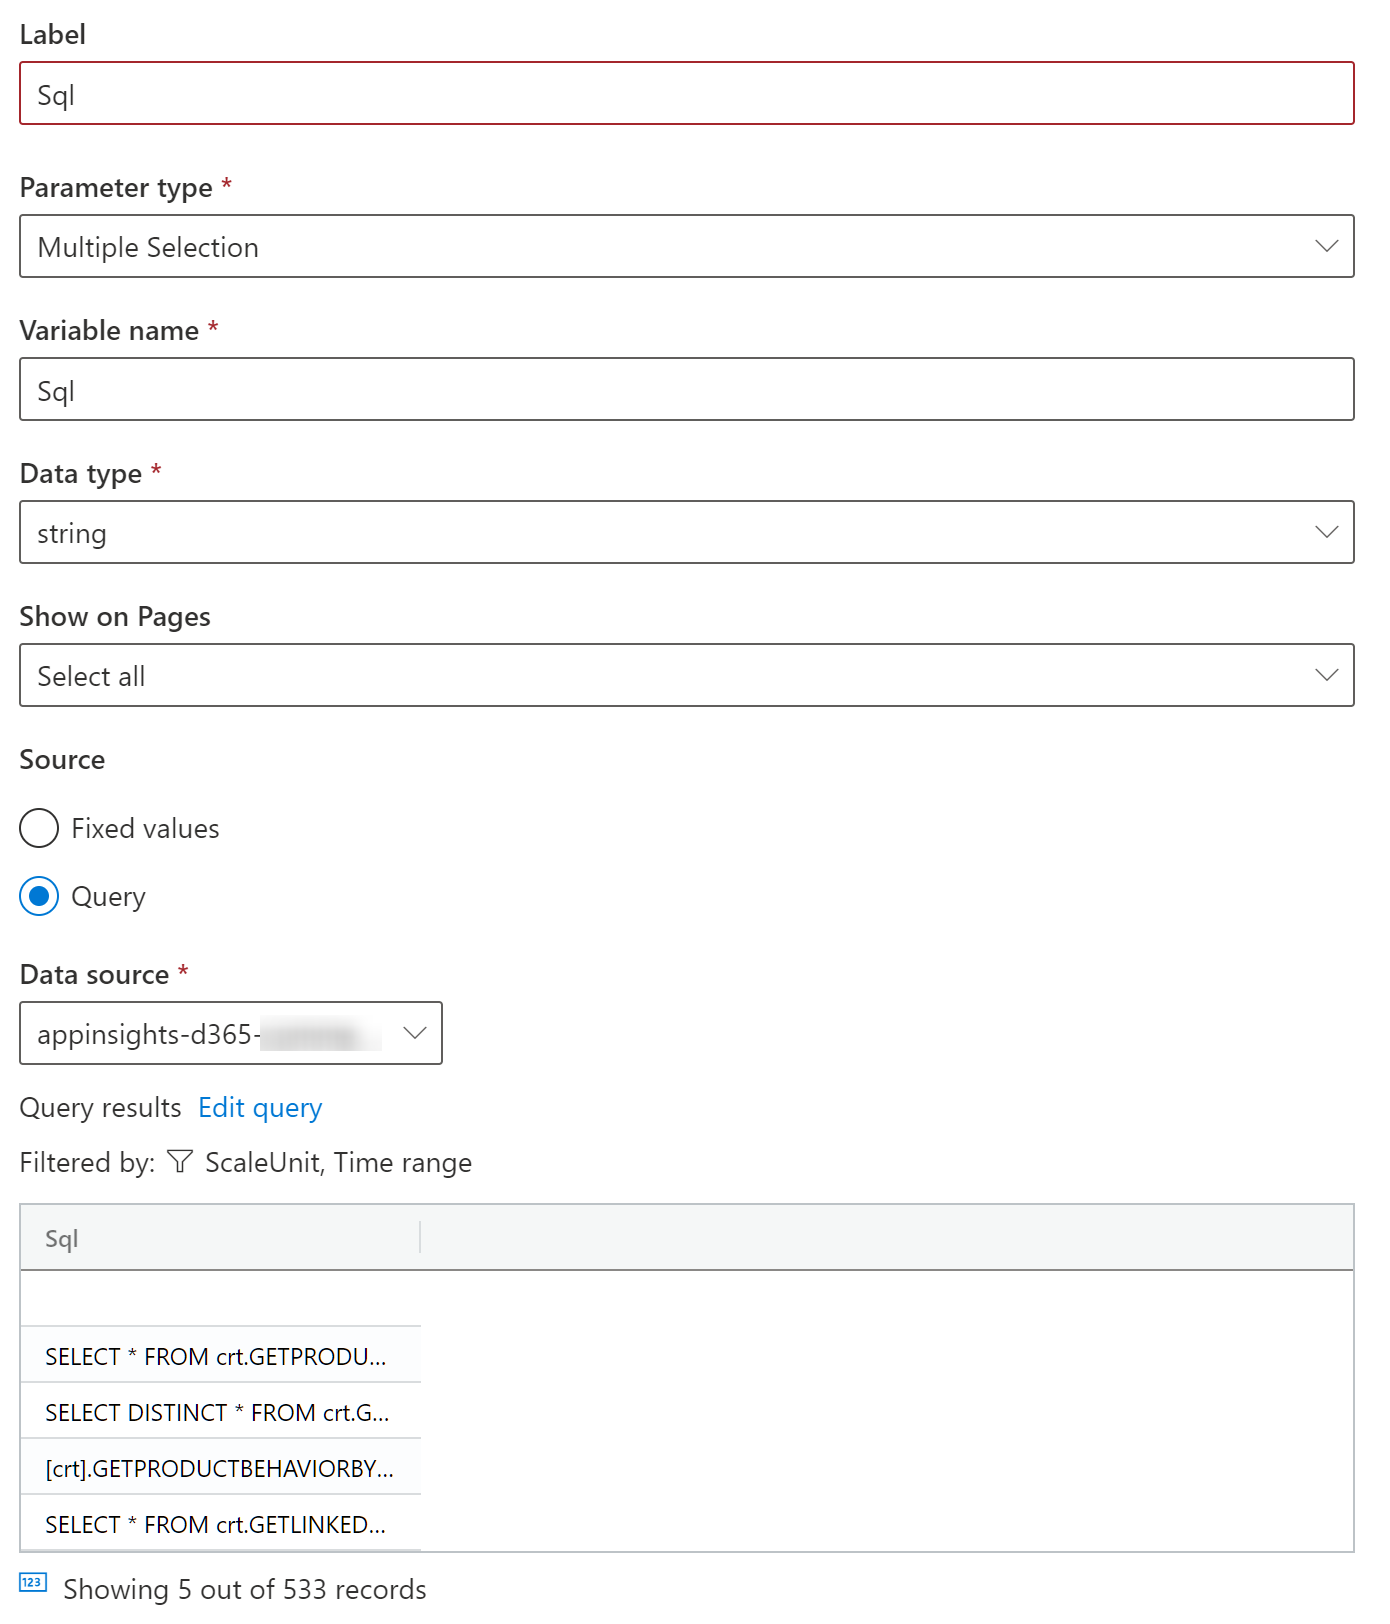
Create a new “Sql” parameter as below
At this point, we are done with the parameters. The dashboard should show these new query parameters:
The store-side business logic for Dynamics 365 Commerce is often extended with custom code. There are no limits to what a CRT extension can do. It can use process existing data from the database, can process data from extended tables, or can call external systems. Some of these changes to the out-of-box experience (OOBE) may impact performance negatively. Assuming the custom code is already optimized, meaning proper database indexes are applied, there may be cases when caching can lead to additional performance improvements. Note that there are ways to cache to the database, but in my experience memory caching is easier to implement and maintain. I have come across a few cases when caching was useful:
Calculation/fetching of local data is expensive. Data needed often enough that the processing impacts the experience. Data are not needed in real-time (some delay acceptable)
Calculation/fetching of local data from the database. Data are needed very frequently and even 50ms database calls may add up in total. Data are not needed in real-time.
Calling an external API (i.e. Real-time transaction service or other services). Data is needed frequently and data does not need to be real-time or changes rarely (i.e. secret keys)
Fetching data that is always static for a store, customer, cart, product, etc. but still expensive to fetch.
Cases 1 and 2 are similar to any data that can only be edited in the back office and need to be synced to the channel. Because of that, they are by definition not real-time data and could be cached further if its needed.
Focusing on the cases where the data is not real-time or truly external will usually give already good gains to the user experience.
There are some cases where data can also be written in the channel. These are usually a little trickier to cache. Think about saving customer data and still seeing the old data after refreshing. In some cases, these issues can be overcome, for example when the cache key is based not only on a simple key but maybe some other data that changed (i.e. cart, etc.).
Another important note: Since we are caching in memory of a web server and there are multiple load-balanced servers, there will be multiple caches. This does not present a large issue, as requests from a single user usually get routed to the same server.
Memory caching use cases
The different use cases (including proper logging as described here and memory cache implementation) discussed below are available for download.
Feel free to take a look or use for your project at your own risk. Let me know of any bugs.
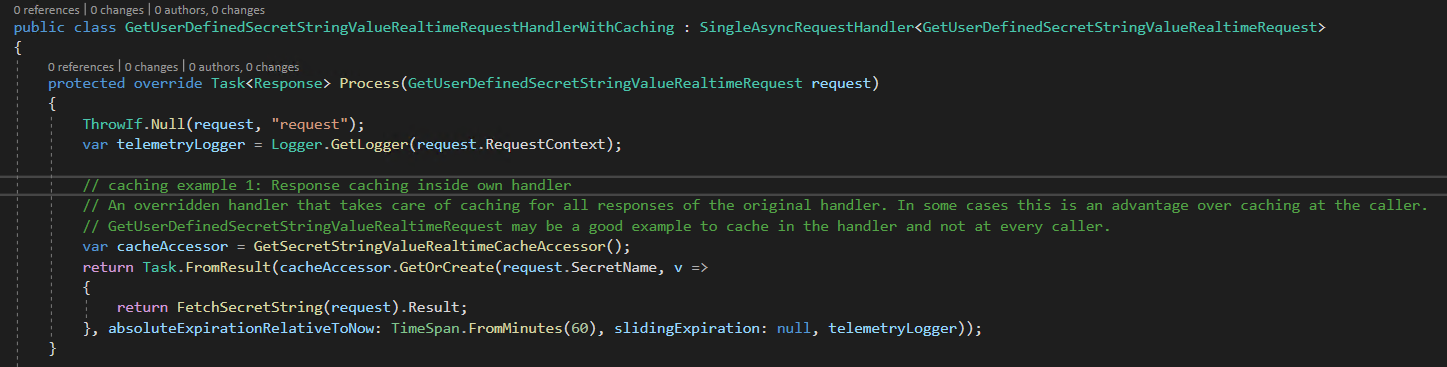
Case 1: Response caching inside own handler
You can override a request handler and have the new handler take care of caching for all responses of the original handler. In some scenarios, this is an advantage over caching at the caller. GetUserDefinedSecretStringValueRealtimeRequest is a good example to cache in the handler and not at every caller. We can assume that the secrets can be cached for a certain time safely.
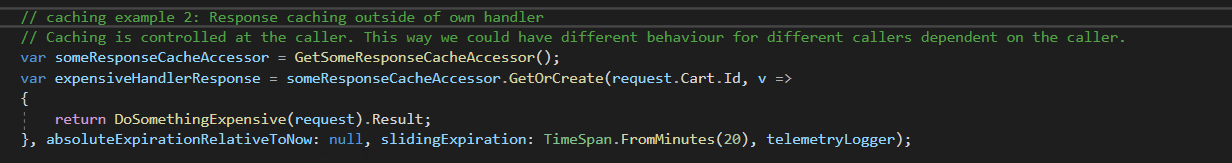
Case 2: Response caching outside own handler
In this case, the caching is controlled at the caller. This way we could have different behaviors for different callers, dependent on the caller. If the same caching code would have to be added to multiple places, and the same caching behavior is needed, consider use case 1 instead.
Case 3: Simple value caching outside own handler
This case is similar to case 2. The caching occurs at the caller. However, we may not always have a “proper” Response but a simple value to cache.
Operations Insights, Applications Insights and custom logger to maximize results for Dynamics 365 Commerce CSU code.
Anyone who has troubleshooted a production environment with diagnostics traces in order to understand why a certain operation did something unexpected knows that it can be quite difficult. Anyone who also had to find not enough traces were available will agree that it would have been great if they had just spent the time to do it right…
So, if you have not yet, let’s do it right this time.
There are 2 logging-related topics I want to discuss first with regards to tracing in the Commerce CSU.
Operational Insights
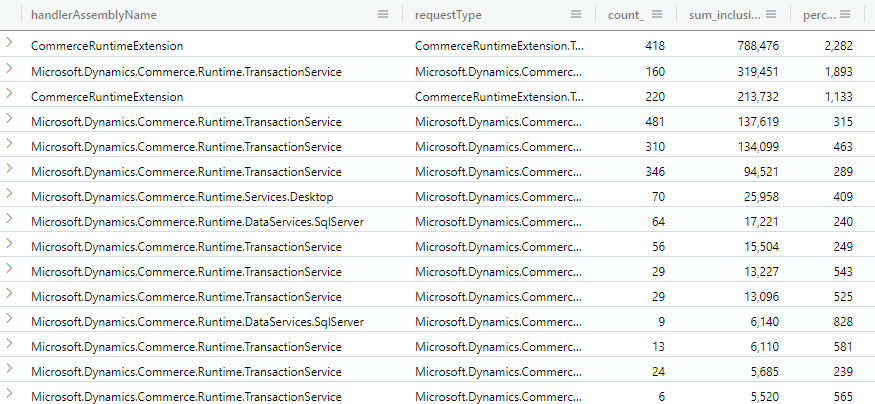
Operational Insights. Enabling it will allow you to see almost as much as Microsoft. You can check on slow queries, long running operations, errors, count how many Checkouts you had and so on. The following screen shot is from a dashboard that uses the Operational Insights data from a performance environment. It’s very easy to see what the slowest SQL statements are.
A simple performance dashboard that uses Operational/Application Insights
Details about how to use the data is something for another blog.
Extension code instrumentation
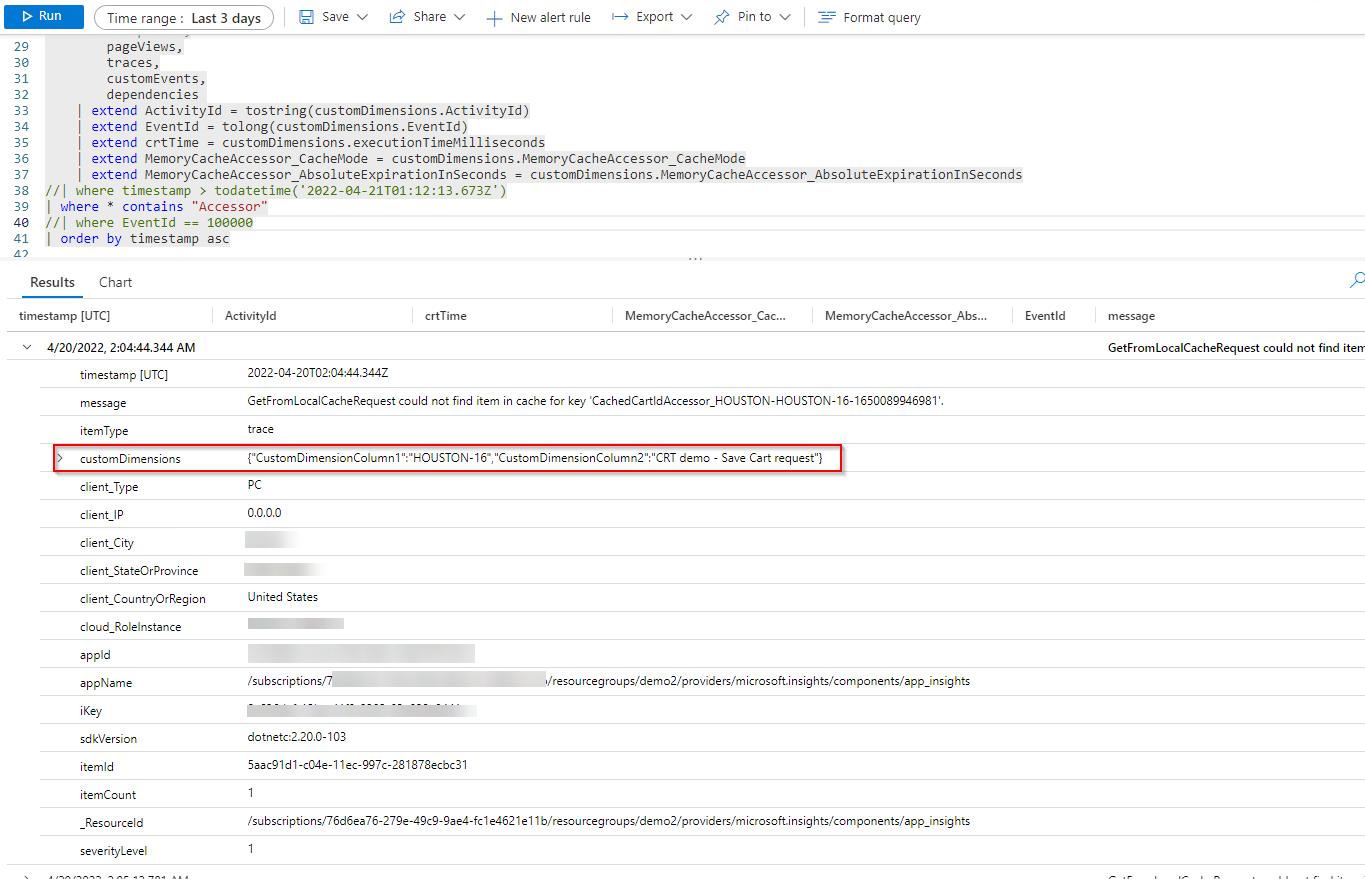
Instrument your extension code for Application Insights. When a customer or partner extends the Commerce functionality, Microsoft recommends to properly instrument the extension code with logging statements. The documentation includes a simple class that can be used for logging. Once done and the code is deployed, it will emit traces that look like this:
A custom trace in Application Insights
I have highlighted the customDimension property in red. It is an important piece of information as we have the capability to put anything into the trace for later querying.
Improving the logger class
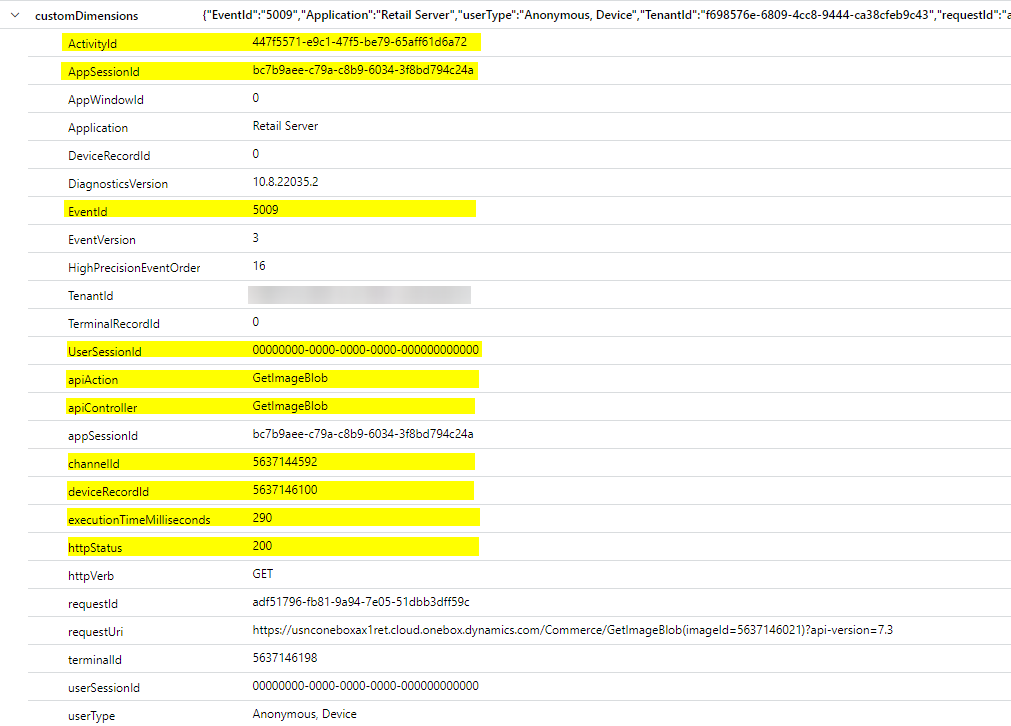
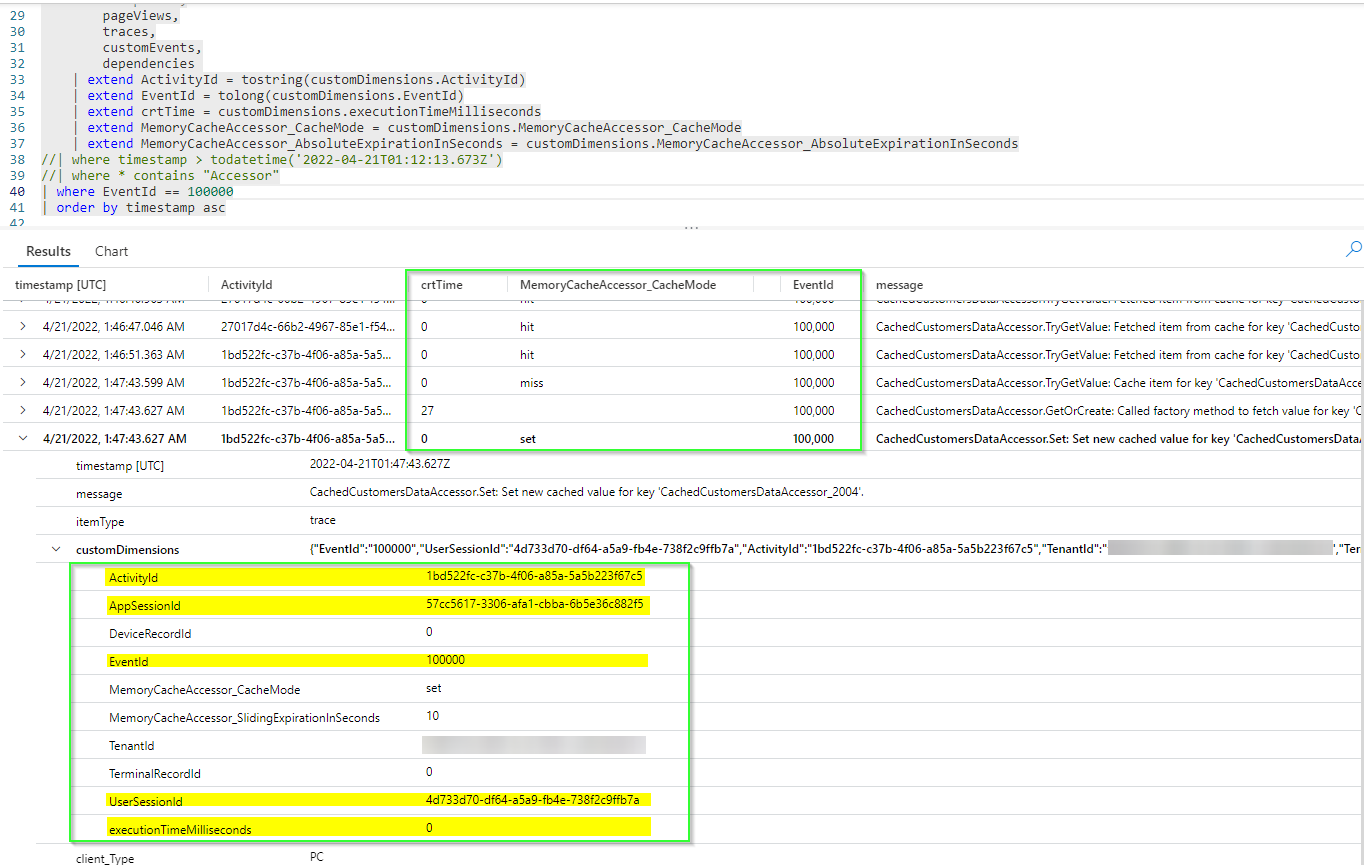
Any out-of-the-box trace that comes from the CSU has many data inside customDimension. The ones that are very useful to filter or correlate with while querying Application Insights (with Kusto language) are highlighted below in yellow:
out-of-box experience (OOBE) traces and its customDimensions property
The concept of an ActivityId allows you to query for all traces that occurred as part of one request.
AppSessionId is for all data from a terminal.
UserSessionId is unique for each logged in user.
There are many more that are pretty self-explanatory.
I was able to improve the simple logging class that Microsoft provides in such a way that customDimensions holds more meaningful information. In the screen shot below you can see that many of the out-of-box experience (OOBE) properties are now included in the custom trace.
Once we instrument the code (in places where it would aid troubleshooting), we have a great chance to find issues just by looking into the Application Insights store. The code to write a trace is simple:
var logger = Logger.GetLogger(request.RequestContext);
var trace = logger.CreateTraceWithSessionContext(SeverityLevel.Information);
trace.Properties.Add("executionTimeMilliseconds", stopwatch.ElapsedMilliseconds.ToString(CultureInfo.InvariantCulture));
trace.Properties.Add("EventId", "100000");
trace.Message = "Some message";
logger.TrackTrace(trace);
Feel free to take a look or use the logger for your project at your own risk. Let me know if you find any bugs. It is ready to go for a Dynamics 365 CRT extension project based on the latest Commerce SDK.
A typical D365 Finance and Operations implementation project usually requires multiple tier-1s developer environments. Each developer needs her own and they are also often used for prototyping, testing, and housing golden configurations. The accumulated cost can be pretty substantial. On the other hand, users often complain that the performance of the default-sized VMs is not great and try to increase the size for better experience.
Cost and performance are hard to get a handle on together. To put it simply, it seems to be an either-or situation. I have asked myself how an optimum can be found. Personally, I would define the optimum to be a very fast user experience when I use the VM at a very small additional cost. I use two approaches that help me. Since I noticed that many struggle with the same issue, I am sharing the two things I do to manage it. However, note that it is a requirement to have administrative privileges for the VM in the Azure portal.
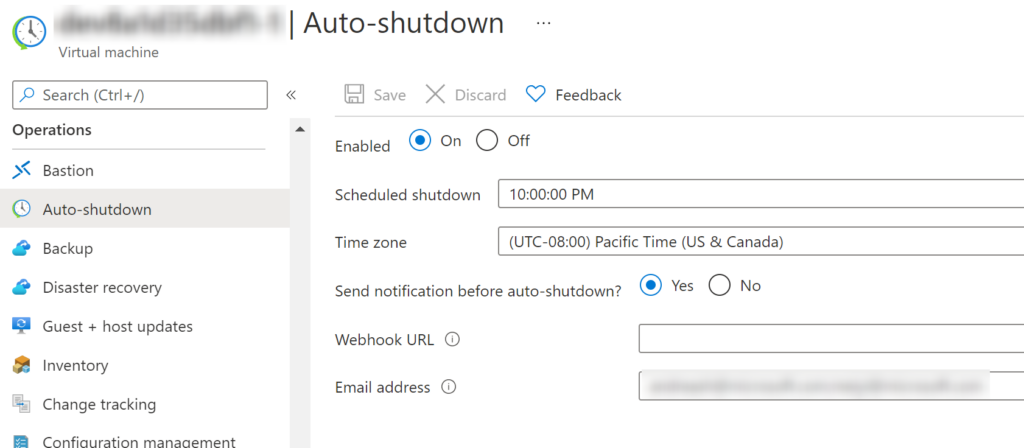
Set up a daily Auto-Shutdown
I setup the VM to be shut down automatically every night. I get an email about it 30 mins in advance so I could change my mind in case I am still using the VM. It’s a way to keep the running time of the VM down, in case I forget to shut it down manually. With that setting, the VM has to be explicitly started again, so often I have the VM off for a few days which saves cost. Below is the setting in the Azure portal.
I usually start and stop my VMs manually.
Scale VM and disk sizes up and down
Consider the time a VM is actually running versus when it is stopped (when you do not need it). In my case, the running time is a small percentage. Because of that, I can justify scaling up the sizing at additional cost for the few times I use it.
There is a lot of public documentation about VM sizes and disk sizes and what workloads are better for some than others. I am not repeating this here, but just want to share my approach. I encourage you to experiment and share your comments.
Important note: The disk sizes incur cost even when the VM is stopped. It is not enough to stop a VM, it must be also scaled down. Make sure to understand this!
My Low-cost config for a stopped VM (cheap)
VM size (VM/Settings/Size): Standard B8ms (8 vcpus, 32 GiB memory)
Disk size for all disks (each disk/Settings/Size + performance): Standard HDD LRS
My High-performance config for a started vm (very fast)
VM size (VM/Settings/Size): Standard DS13_v2 (8 vcpus, 56 GiB memory)
Disk size for all disks (each disk/Settings/Size + performance): Premium SSD LRS
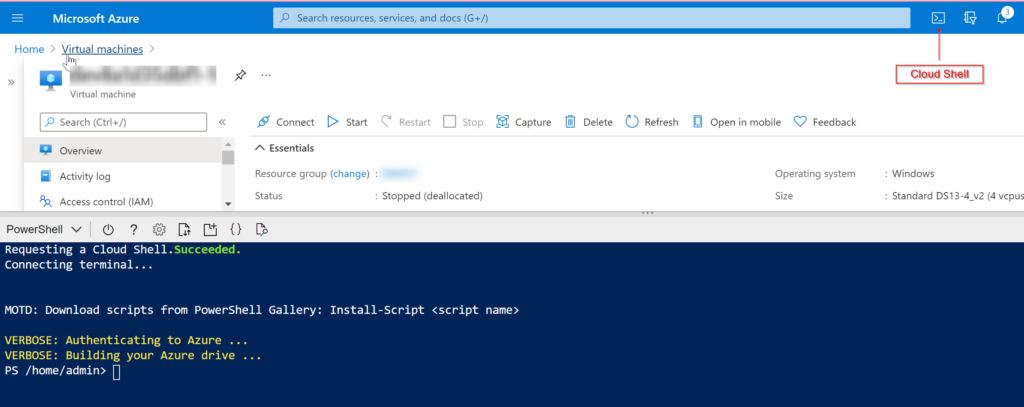
Powershell scripts to scale up and down
I am sharing 2 scripts that take care of the scaling. You can run them right in the Azure portal’s Cloud Shell. Just configure your resource group name and VM name, save the scripts and upload them to the Cloud Shell’s home directory.
When I want to use the VM, I run the scale up script and when the script finished, the VM is started.
When I am done using the VM, I run the scale down script (which also stops the VM).
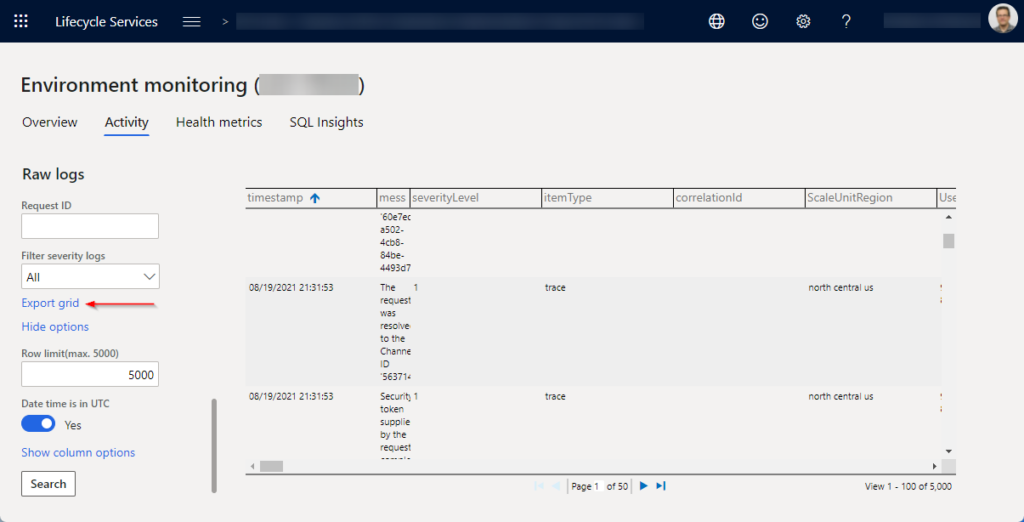
There are occasions when a customer, partner, consultant, or support engineer needs to look at the low-level Dynamics 365 Finance & Operations telemetry data. These use cases include troubleshooting of errors, performance-related investigations or just to gain some additional understanding of how the platform work. Telemetry data can be accessed by authorized users via the Environment monitoring part of the LCS portal, can be filtered in a few different ways and displayed inside the LCS portal’s raw logs section. A data grid can be used to inspect the log entries. LCS does not allow for more sophisticated pivoting and users can use Excel for that purpose. For that purpose, the telemetry data can also be downloaded formatted in CSV format.
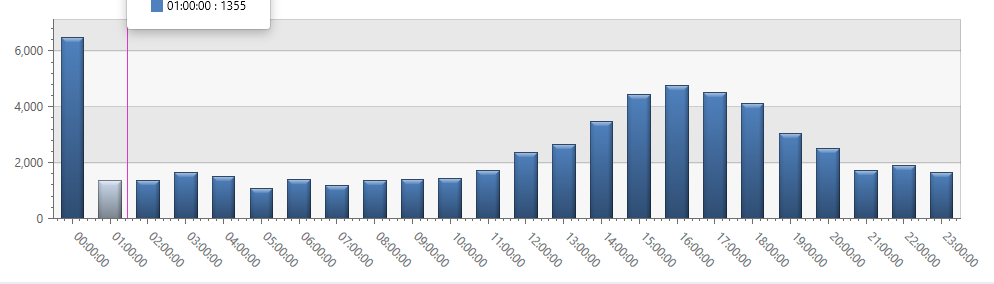
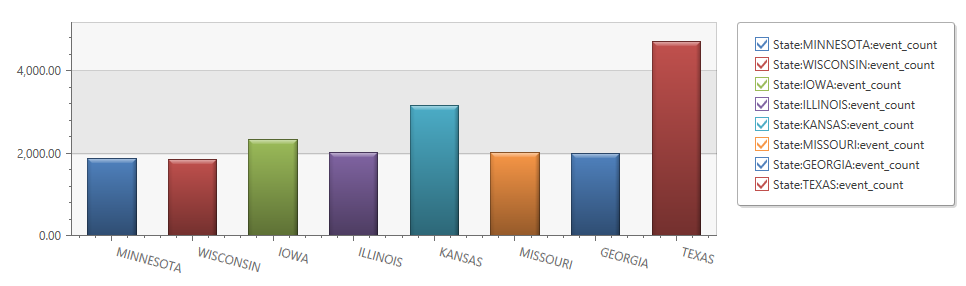
However, Excel is not the optimal tool for advanced querying of this data. The perfect tool, designed for this purpose is the Azure Data Explorer. It provides an innovative query language Kusto that is optimized for high-performance data analytics. Answering questions like “how often has a certain process taken place, how long has it taken in 90% of the times, how often per hour has a certain action taken place over the course of a day” becomes a lot easier and can be backed up with powerful graphics as well.
Here are examples how the graphics could look like:
A less known feature of the Azure Data Explorer is that it supports ingestion of CSV files. We can use it to get our CSV data files uploaded and staged so it can be queried with the Kusto language. If you have not setup Azure Data Explorer Cluster, follow these steps.
Steps to upload to Azure Data Explorer
Run your query on LCS raw logs page
Important: adjust the time interval or – filter to get to the right data (row limit is 5000 for export in next step)
export the grid to Excel
Open the file in Excel and save it without making any changes (this seems to fix a formatting issue)
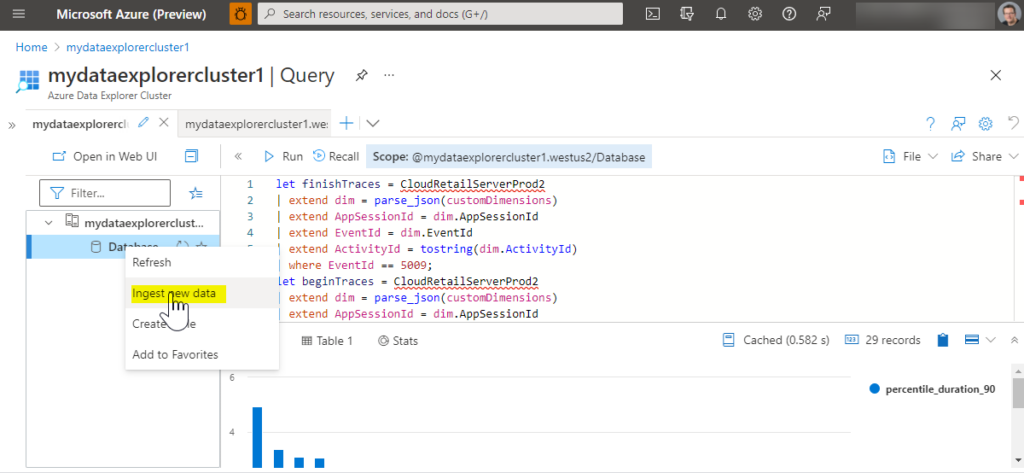
In your Azure Data Explorer, right click on the cluster in the tree view and select “ingest new data” and then on the next page “ingest data from a local file”
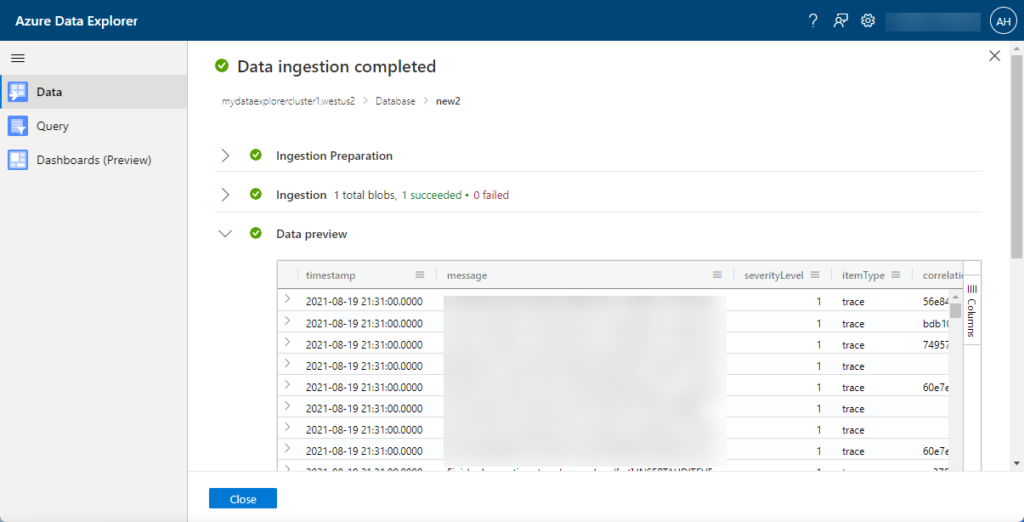
Pick your cluster, name a new table for the data to be imported into, select up to 10 CSV files to import, select CSV format. Hit next a few times till your data is getting imported.
Use the Query tile to write a Kusto query against your data.
To learn more about the Kusto query language, go here.
Sample queries
Modern POS
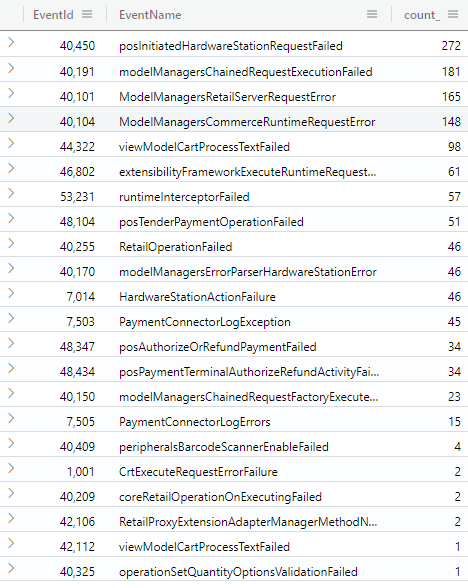
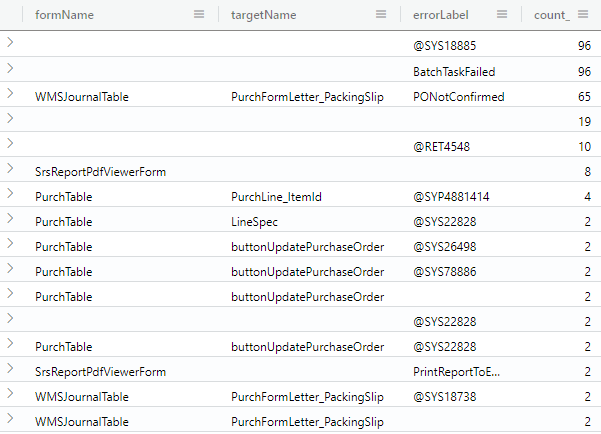
all errors
Sometimes its nice to get an idea of what all the errors are. The use of the text fields to describe errors is not consistently used, so its better to use the EventIds and map them to the correct errors. They can be looked up in these two Commerce SDK files (but using the code snippet below may give you all of them already):
A next step would be to go through each of these error types, and look at them closer. A few of those could indicate quality issues that could effect the user experience.
In many cases, these errors can be fixed by cleaning up the extended code, adding proper SQL indexes or investigate better problem approaches.
In some cases, these errors could indicate problems with out-of-box experience (OOBE) or deployment. Please open a support request to get these fixed by Microsoft.
// Note: use selection "All error events" to only get the errors
FNOErrors24h
| summarize count() by formName, targetName, errorLabel
| order by count_ desc
FormName, targetName, errLabel are all good candidates to look up in Azure DevOps to find out the code location. That gives more insight in what areas these error occur.
Example: The @SYS18885 is thrown from ReqPlanData class. Now I can focus on figuring out why that is the case (is Master planning not configured right?)
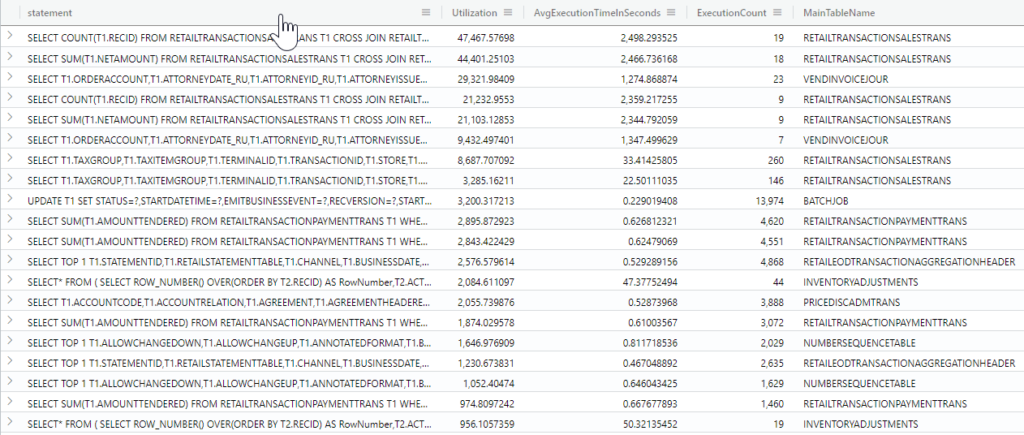
Slow SELECT queries
// use selection "slow queries" in LCS diagnostics
SlowQueries
| extend MainTableName = extract("FROM\\s([A-Z0-9]+)\\s", 1, statement)
| where statement contains "SELECT"
slow inserts
// use selection "slow queries" in LCS diagnostics
SlowQueries
| extend MainTableName = extract("INSERT INTO ([A-Z0-9]+)\\s", 1, statement)
| where statement contains "INSERT"
Slow deletes
// use selection "slow queries" in LCS diagnostics
SlowQueries
| extend MainTableName = extract("DELETE FROM ([A-Z0-9]+)\\s", 1, statement)
| where statement contains "DELETE FROM"
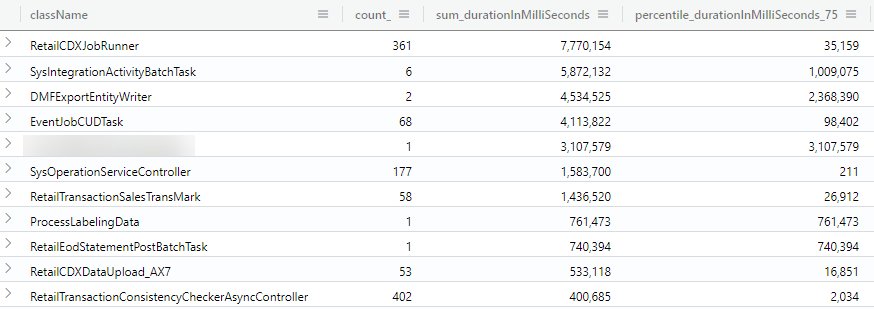
Batch jobs performance
// use selection "All logs" and add query "where TaskName Equals BatchFinishedOneTask" in LCS diagnostics
BatchFinishedOneTask
| summarize count(), sum(durationInMilliSeconds), percentiles(durationInMilliSeconds, 75, 90) by className
| order by sum_durationInMilliSeconds desc
Are there a few F&O forms that you use over and over again as part of you role in your business? Maybe to check on batch job status? Or Commerce CDX sync job failures? Or to check on available inventory counts in the warehouses?
If you carry out these or similar steps on a regular basis, you will realize that you keep doing the exact same clicks, and quite a few clicks, in order to get to the form as you need it. You have to get to the form, possibly adjust filtering and change sorting…
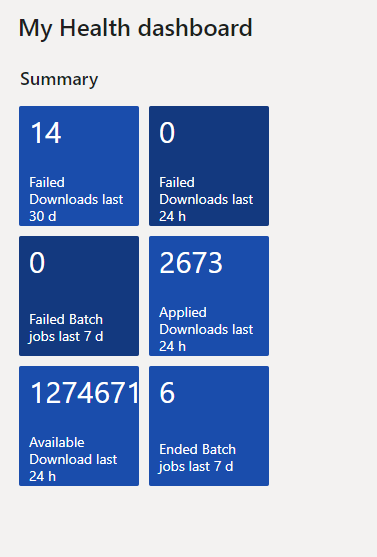
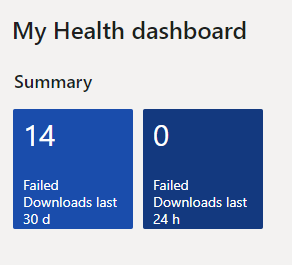
Do yourself a favor and use live tiles to your advantage. A live tile is a quick link to the form of your choice including filtering and sorting stored as part of the tile. Even better, it will show you a quick count of rows right on the tile. If you add a few live tiles onto a dashboard, you can then quickly build your own simple dashboard. Here is a sample dashboard I built.
How do you create a dashboard like this? Follow the steps:
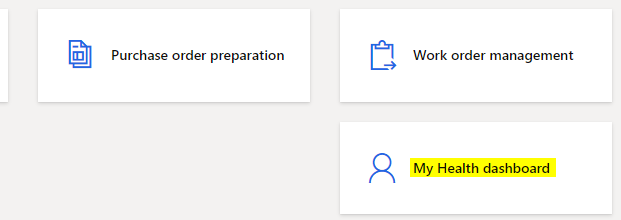
Create a new workspace. I called it my Health dashboard.
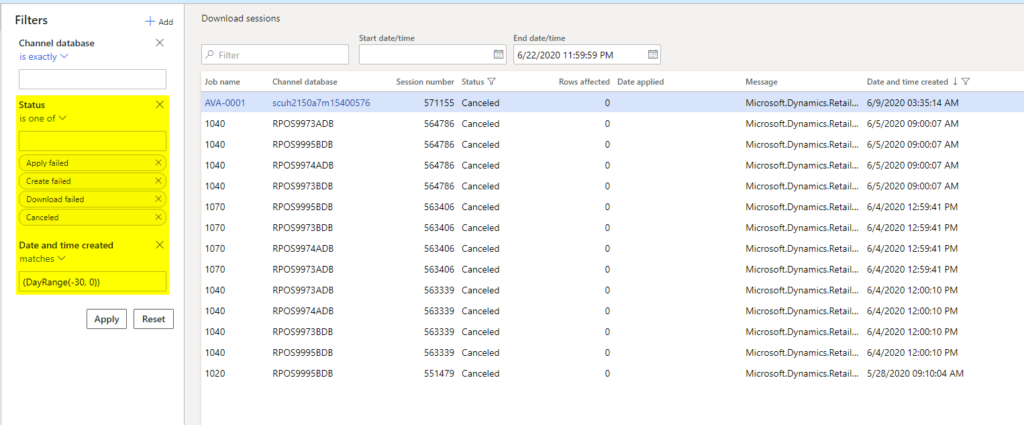
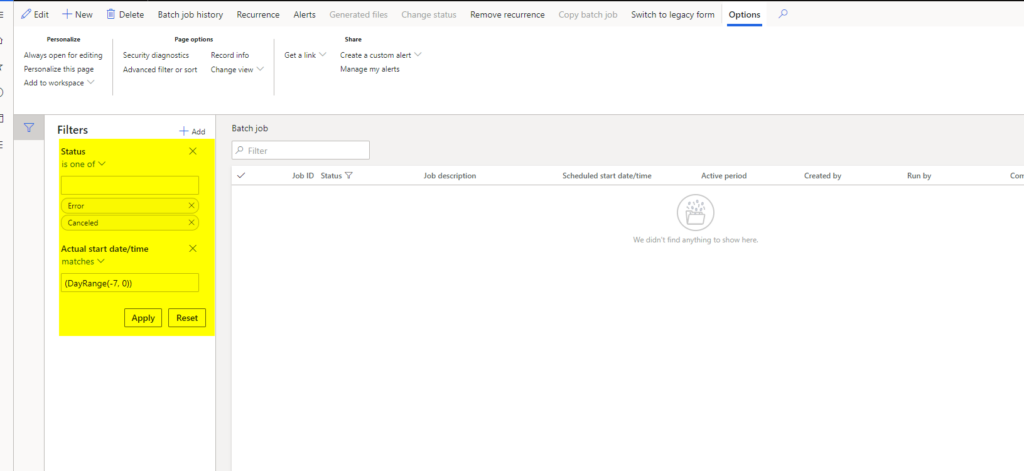
As an example I will use the “Download sessions” form. Edit the filters and apply the specific filter criteria that gets your job done. Consult the documentation about Advanced filtering query syntax for more details and examples.
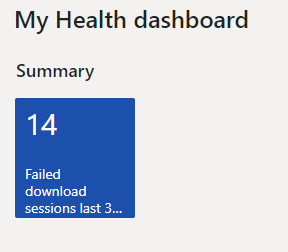
Click options, Add to Workspace, pick your workspace you created earlier. Configure it as a tile, name it appropriately and choose whether you want to show the count. Then hit OK.
Clone this query by using the tile to navigate to the form and make some changes. If you wanted to just change the timeframe, make that small query adjustment, and add another live tile to the workspace.
Build other queries for other well visited forms.
Query for failed batch jobs
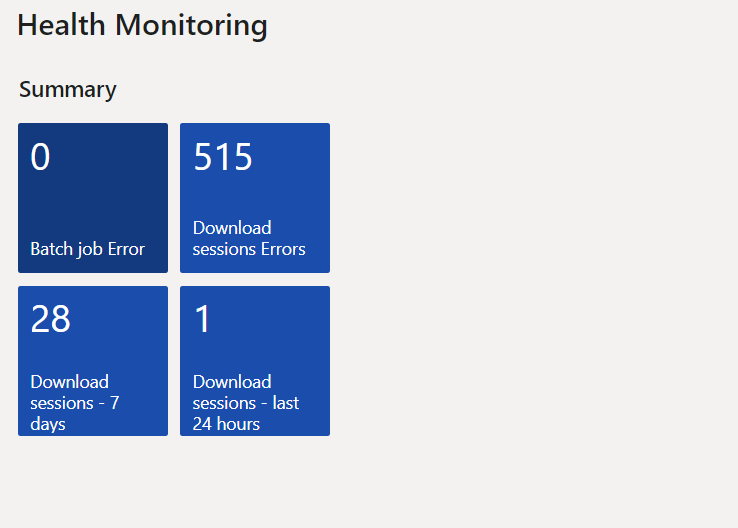
All done. Now you can go to the dashboard and see immediately if there is something you need to take care right away. Or you can just use the tiles as quick entry points to where you need to go…
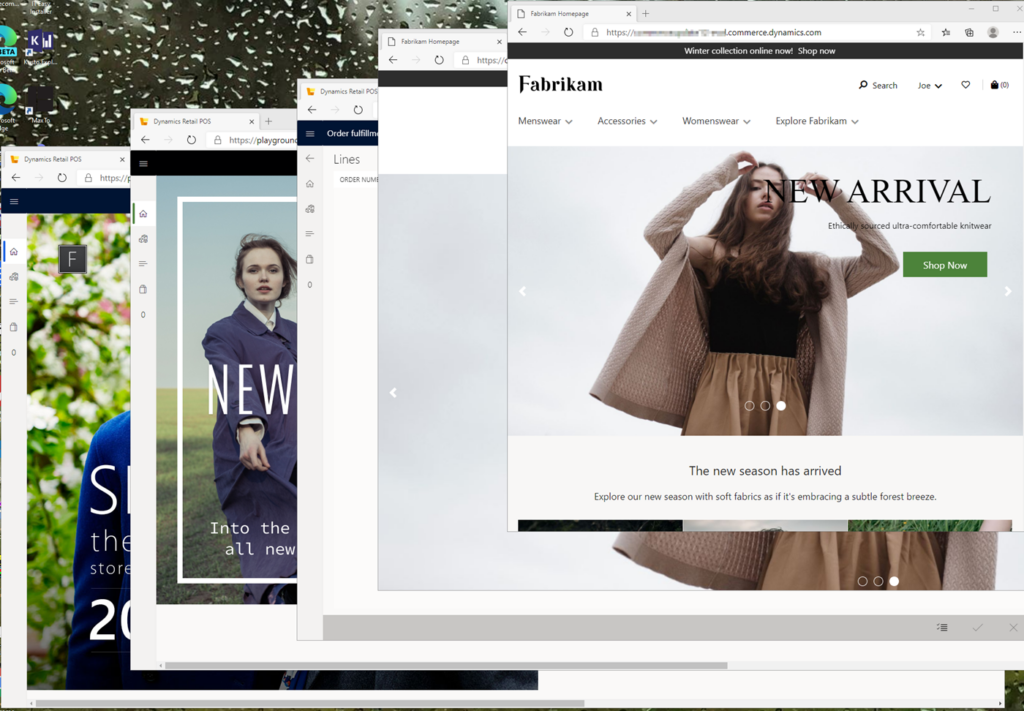
If you are like me, you sometimes need to quickly activate a new Dynamics Cloud POS terminal to test new functionality or log into another eCommerce site you have been working with. And, you may even need to compare the behavior between different logins.
The challenge is that doing the above in your default browser instance and default profile will overwrite your previously activated POS terminal or log your other eCommerce user out. After all, you can only have one identity at a time.
Some users use different browsers to solve this problem. Use Microsoft’s Edge to activate HOUSTON-16 terminal and Google’s Chrome to activate HOUSTON-19. These could be both point to the same RetailServer or Cloud Scale Unit or to entirely different ones. Good solution, but keep reading for a more convenient option.
Browser profiles to the rescue. A browser profile can store bookmarks, passwords, search history, extension and other settings. The moment the browser switches over to a different user profile, all these different data are switches as well. We can use this to our advantage. Also, this is feature is available in most browsers.
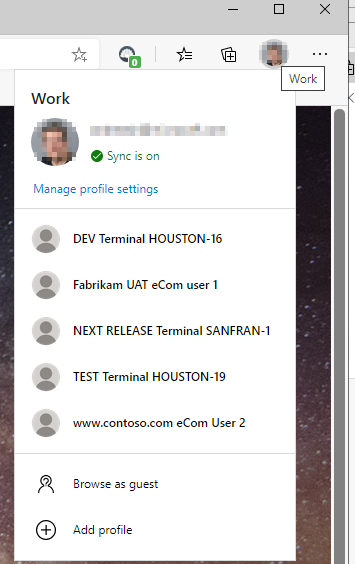
The idea is to create a profile per user that you are simulating. You can then save user and password and bookmarks and start page to that profile, give the profile a meaningful name that helps you remember what this “client” connects to. All you need to do is to click on the little avatar in the right upper corner of the browser and either “Add profile” or “Manage profile settings”. When done, you could have 3 different Cloud POS terminals and 2 eCommerce logins all neatly organized in your favorite browser. That’s exactly what I did:
Microsoft Edge profiles for different terminals and authenticated eCommerce logins
Now, you can quickly launch any of these and even use them all at the same time:
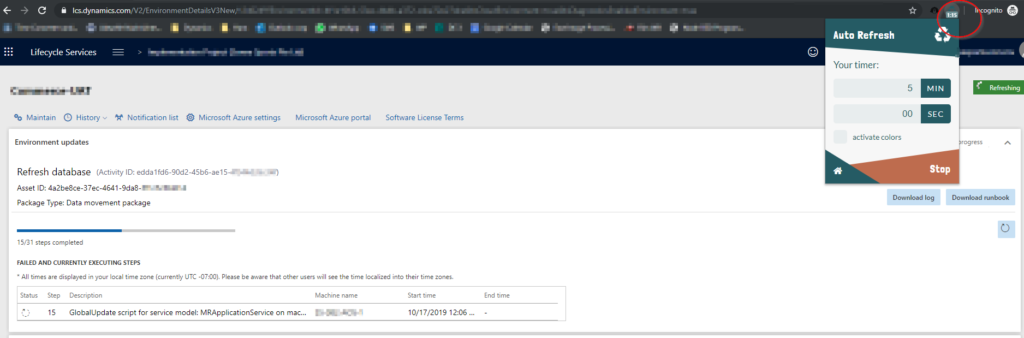
Have you deployed Microsoft Dynamics 365 F&O environments, packages, moved databases etc. using Microsoft Dynamics Lifecycle Services (LCS) before? If you have, you know that all of these operations take time, and in order to see how far it has progressed, you need to refresh the page. Also, you may waste time working on something else and forgetting to refresh the LCS page once in a while.
A simple solution to the problem that works well for me is to use a Google Chrome extension “Auto-Refresh” that allows for automatic and configurable tab page refreshes. With that you can have the browser sit in a corner of your screen, and when the LCS operation is done you will see it, without having to refresh the page.
Steps: – Install the “Auto-Refresh” Google Chrome extension – allow incognito browser sessions to use the extension too (as often I impersonate other users and use incognito for that) – click the extension’s icon and configure your refresh time. Be reasonable, a good refresh time is every 5 mins – now work on something else useful till you see the LCS operation is done
The CommerceRuntime is the business logic for Retail POS and other channels. Here are a couple of good rules how to correctly configure it.
In both of the commerceRuntime.*.ext files, be specific about what handlers you want. Do not use a wildcard inclusion for the whole assembly. If you do the latter, you have no choice about what handlers are disabled, etc. The example below should help.
Even though you could write code that figures out where the runtime context is online or offline, its not a good practice. Its better practice to use the config file to control that. See example below.
To enable different functionality for online and offline scenarios, you have multiple options:
If you do not want/need offline mode at all, either disable the feature for that register OR install the installer that does not include the offline part.
If you want just the built-in offline features (fewer features than online), you can have an empty CommerceRuntime.MPOSOffline.Ext.config file
If you want what you get in 3.2) with the addition of a few custom-built features, you can have some of the entries in the CommerceRuntime.MPOSOffline.Ext.config file.
If you want what you get in 3.2) and all of your custom-built features, you should have the same entries in CommerceRuntime.MPOSOffline.Ext.config and CommerceRuntime.Ext.config
Notice that the config files are almost the same, with the one difference that the online version has 3 more handlers (ProductAvailability, PurchaseOrder related). Those are based on RTS calls which cannot be done in offline mode.
There are times when a deployment fails and even a re-try does not help. In these cases, a service ticket should be opened to the Microsoft engineers.
However, there are cases when this is not feasible or helpful. For example:
its a tier 1 development environment and you caused the issue, or
you cannot wait and need to get it done very fast, or
you moved the database but did not run the Retail Re-provisioning tool and the Retail deployment fails now (and you do not care because its not a Retail project).
In these and other cases, it may be OK to just step over the failing step and let the deployment finish (in non-production environments).
The following steps can be used to workaround. Again, this is almost “hack” territory, but sometimes is needed…
Find the step number that failed. LCS should tell you. Say for a moment, it’s step 43.
Wait till the deployment is in “Failed” state.
Login to the VM where this error occurred. This can also be found on LCS portal.
Find the current runbook.xml. Its under C:\RunbookOutput, and is going to be the latest changed file.
Open it in your favorite XML editor (i.e. Notepad++) and find the step with the number (search for “>43<“)
Mark the step “Completed” (from “Failed”).
Save the file and resume the deployment from LCS.
Note, sometimes I have found that marking this step is not enough. If that is the case, you can also edit the PowerShell file that the step calls into and essentially comment out all the code. The PowerShell file will be in the service directory under AOSService\DeployablePackages.
Again, this is a hack, but sometimes desperate times call for desperate measures.
An often-requested Dynamics Retail channel feature is the support of store credit cards. The retailer wants to encourage the use of a store credit card; so if the customer uses it, he should get a discount percentage.
Ideally, we should be able to configure the discount percentage, the products that should apply or not, and certain other ordering rules for the discount (apply on-top of other discounts or replace other discounts if better, etc.). The retailer should be able to configure these in Headquarters (AX) without changes in the channel.
This discount applies only during or right before payment, it cannot be applied during simple add-to-cart operations, like other discounts.
Modelling the discount as an affiliation
The pricing or discount engine is a complex piece of code. Even though it supports extensibility features, I would rather not go there. Is there an easier way to do that? Yes, there is. Read on…
We do not want to apply the associated discounts automatically but rather only when a special store credit card is used. We can use affiliation and affiliation price groups to achieve that. The only thing we need to “code” is the application of the affiliation to the cart at the right moment (right when the customer checks out with a store credit card).
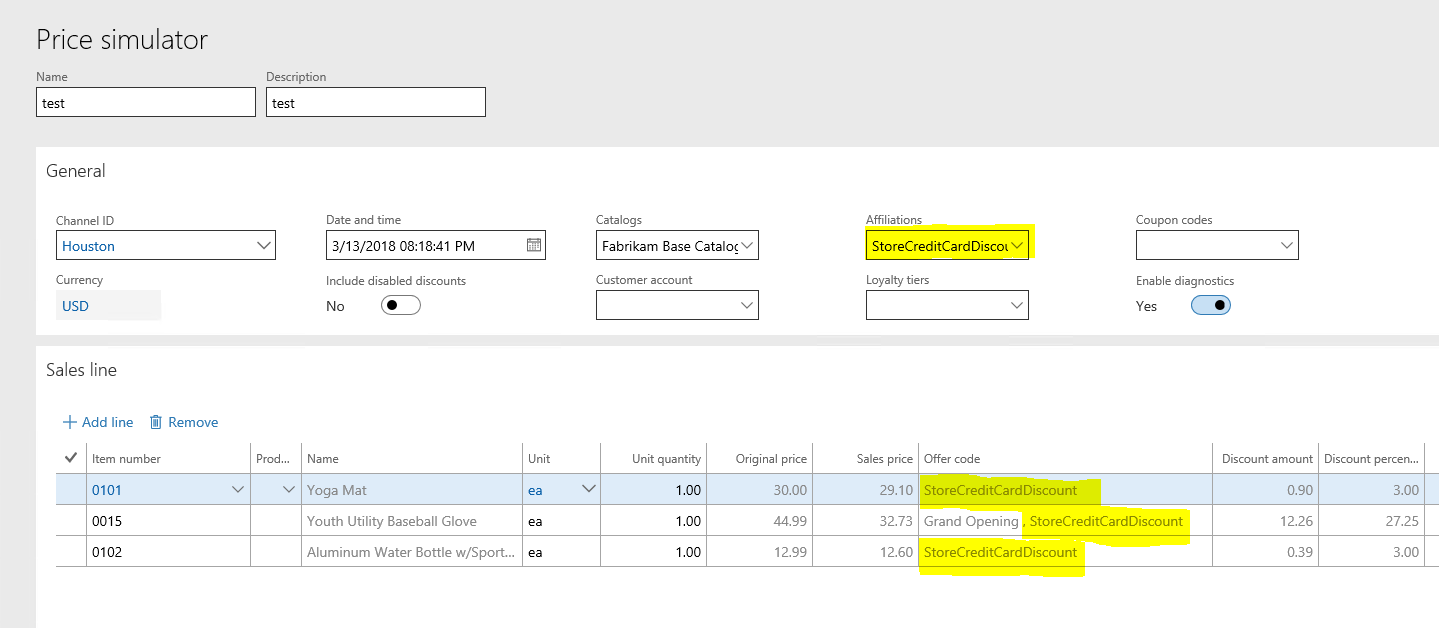
A nice benefit of not needing pricing extensions is that we can use the Price simulator in HQ to verify that our discount rules are correct.
In order to try this out, we need to create a new discount for the products we want, with the right percentage, associate with a price group and add it to an affiliation.
As soon as we save, we can try it out in the Price Simulator. Below, you can see that the store credit card discount is applied to all projects, but other discounts are honored (because the StoreCreditCardDiscountAffiliation was set). As soon as the affiliation is removed from the General section, the discounts would disappear.
Applying the store credit card discount in POS
As mentioned above, we only need to apply correct affiliation to the cart before we checkout, and we are done. That functionality already exists in POS today. So, to simply try this out, I did not need to make any code changes (POS transaction screen -> Discounts -> Add affiliation):
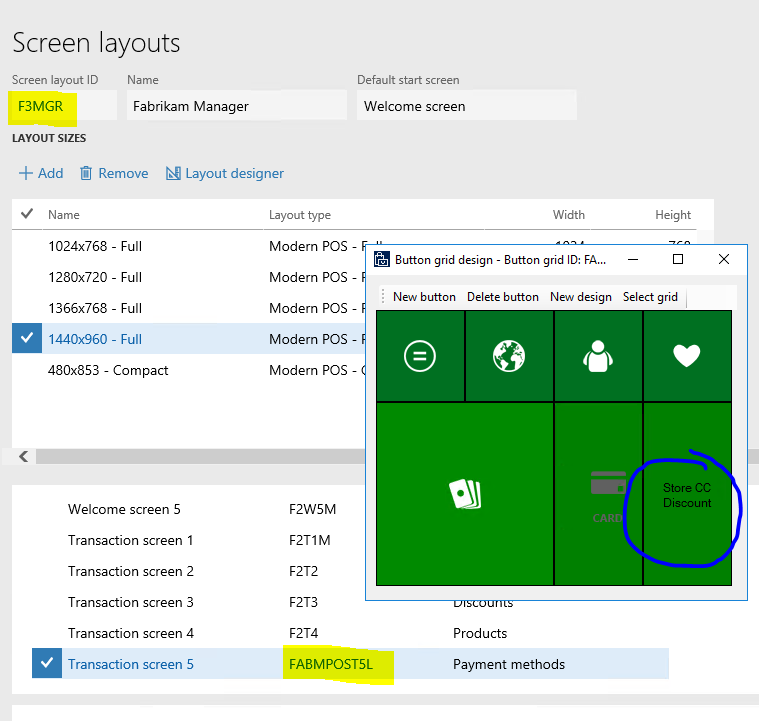
Ideally, this affiliation should only be added right before the store credit card is being used. Therefore I opted for adding a new button next to the “Pay Card” button that will do all the work and the cashier would not need to do this via the “Add Affiliation” operation. See the steps below for details.
It would even be better to “detect” that the credit card is a store credit card and only then apply the affiliation. However, it turned out that this may not be easily doable today, as the payment view in POS does not support this. Hence, I opted for the slightly more manual option where the cashier has choose the button.
Here are the steps to add the button to POS:
In HQ, add a new operation (i.e. StoreCreditCardDiscountAffiliation, 5000)
In the layout designer, edit the button grid and add the button and associate it with the new operations
Run these jobs: 1050 for Affiliation price groups, 1020 for discount, 1090 for the button grid changes
In POS.Extensions project, create a new project StoreCardDiscountExtension, with a new operation mapped to the same Id created earlier, and in there just add the affiliation to the cart.
public executeAsync(request: StoreCardDiscountOperationRequest): Promise<ClientEntities.ICancelableDataResult> {

    let addAffiliationRequest: CartOperations.AddAffiliationOperationRequest =
        new CartOperations.AddAffiliationOperationRequest(["StoreCreditCardDiscountAffiliation",], [], request.correlationId);

    return this.context.runtime.executeAsync(addAffiliationRequest)
        .then((
            result: ClientEntities.ICancelableDataResult
        ): ClientEntities.ICancelableDataResult => {

            return <ClientEntities.ICancelableDataResult>{
                canceled: result.canceled,
                data: new StoreCardDiscountOperationResponse()
            };
        });
}
Applying the store credit card discount in online channel
The same discount logic as above is executed automatically, as we use built-in concepts around discounts (as long as RetailServer is being called). However, just as in POS, we need to add the affiliation to the cart at the right moment. In eCommerce, we can accomplish this by updating the “AffiliationLines” property of the Cart object.
Since in eCommerce the payment process is a wizard with multiple steps, we do not need to add a new UI action to apply the discount affiliation. We can handle this better by detecting the use of a store credit card by number, then apply the affiliation automatically (form the UI or 3rd party ecommerce wrapper). The customer should see the updated cart, while moving to the next payment step.
There may be a time during a Retail project when you likely will hear someone saying: “Doing X in POS is slow. What’s going on?”. If this is the case, my hope is that this during the implementation phase and not on a live production environment.
What do we do to find out what is wrong? Is it a customization to the CRT business logic, latency to an external call, generic latency to the server from POS, or a Microsoft bug?
The following steps will hopefully help to give an answer to these questions.
RetailServer could be either Microsoft hosted or RSSU-hosted. It is agnostic to this investigation, but you need to make sure you are testing against the right RetailServer (especially if you use both Microsoft-hosted and RSSU-hosted at the same time).
Microsoft-hosted RetailServer in production cannot be accessed, so some of the steps below cannot be carried out on a production environment. It is advised to carry these out on a lower tier environment.
RSSU-hosted RetaiSserver, even in production, is under the management of the customer, so the steps below can be carried out, but with care.
Sometimes the slowness could occur only when there are multiple POS used at the same time. If that is the case, you can still use the steps below, but would have to reproduce the issue by running multiple POS.
SQL Profiler can be used to inspect and trace and measure all SQL access. Compared to the Query Store, SQL Profiler provides data that is “less prepared”. However, in some cases that is what’s needed. Follow these steps:
Start SQL Server Profiler and connect to the Channel database to be profiled
Start a new trace with default configuration (and hit Run)
Rerun the scenario for which you want to profile the SQL access
Stop the trace
In SQL Server Profiler, hit File/Save As/Trace Table and save the trace data to a new table, i.e. into tempdb.ChannelDbTraces
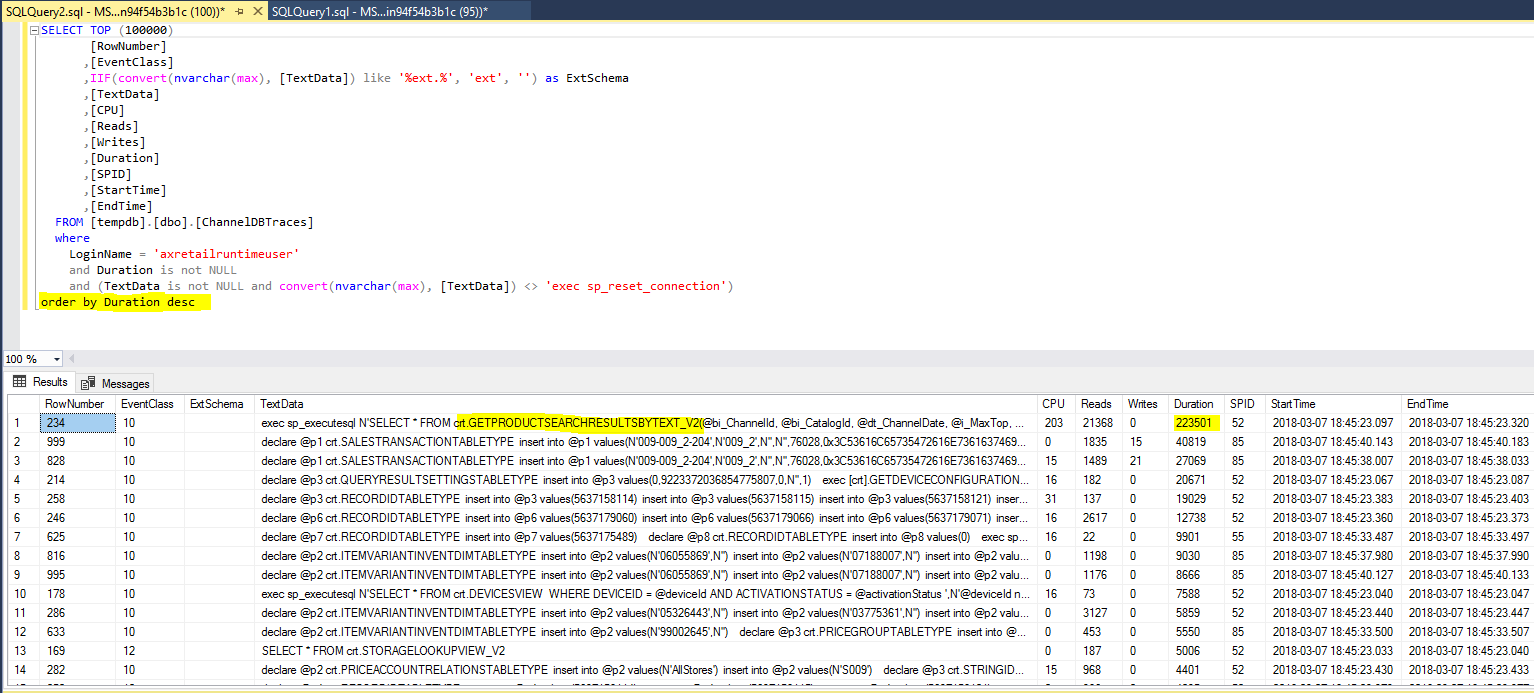
Using SQL Server Management Studio, query the trace table
SELECT [rownumber],
       [eventclass],
       Iif(( CONVERT(NVARCHAR(max), [textdata]) LIKE '% [[]ext%' )
            OR ( CONVERT(NVARCHAR(max), [textdata]) LIKE '% ext%' ), 'ext', '')
       AS
       ExtSchema,
       [textdata],
       [cpu],
       [reads],
       [writes],
       [duration],
       [spid],
       [starttime],
       [endtime]
FROM   [tempdb].[dbo].[channeldbtraces]
WHERE  loginname = 'axretailruntimeuser'
       AND duration IS NOT NULL
       AND ( textdata IS NOT NULL
             AND CONVERT(NVARCHAR(max), [textdata]) <>
                 'exec sp_reset_connection' )
       AND Iif(( CONVERT(NVARCHAR(max), [textdata]) LIKE '% [[]ext%' )
                OR ( CONVERT(NVARCHAR(max), [textdata]) LIKE '% ext%' ), 'ext',
           '') =
           'ext'
ORDER  BY duration DESC
Useful query scenarios:
Longest SQL queries: add order clause “order by Duration desc”. By the way, the Duration columns unit is microseconds.
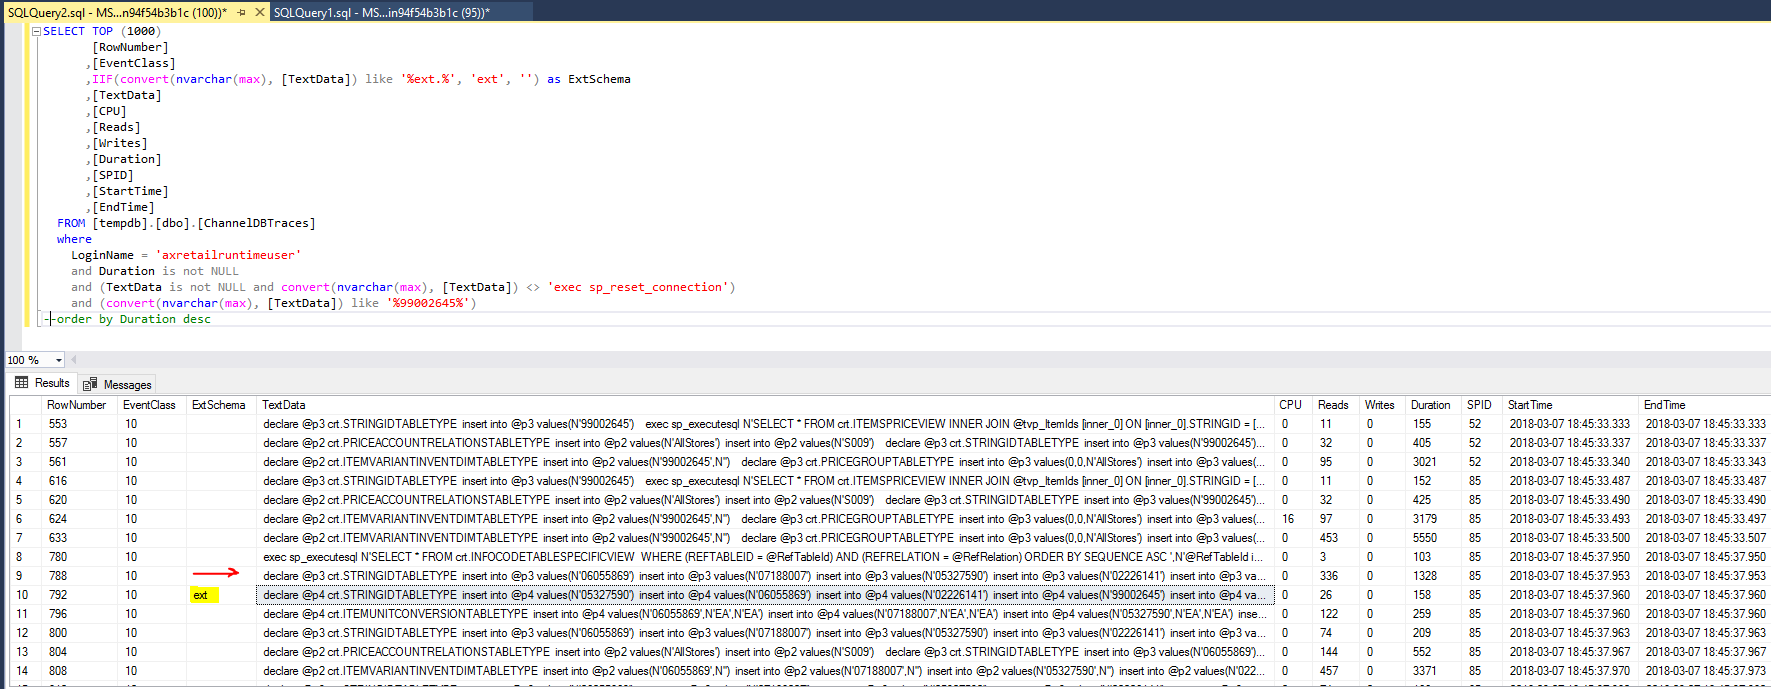
Include only extended SQL queries: add filter clause “and IIF((convert(nvarchar(max), [TextData]) like ‘% [[]ext%’) or (convert(nvarchar(max), [TextData]) like ‘% ext%’), ‘ext’, ”) = ‘ext’” (in 7.2 and later, any custom SQL has to be implemented in the [ext] database schema.)
Find any queries that are called multiple times and order by the number of calls, and execution times. This may help to find out if caching mechanisms could be applied to optimize Microsoft or custom code.
SELECT count(CONVERT(NVARCHAR(max), [textdata])) CountOfExcecutes,
       CONVERT(NVARCHAR(max), [textdata])  as SQLStatement, sum(duration) SUMOfDuration, avg(duration) AVGOfDuration
FROM   [tempdb].[dbo].[ChannelDbTraces]
WHERE  loginname = 'axretailruntimeuser'
       AND duration IS NOT NULL
       AND ( textdata IS NOT NULL
             AND CONVERT(NVARCHAR(max), [textdata]) <>
                 'exec sp_reset_connection' )
group by CONVERT(NVARCHAR(max), [textdata])
order by count(CONVERT(NVARCHAR(max), [textdata])) desc, sum(duration) desc
Looking at these SQL traces can reveal issues with inadequate tracing. Some CRT base entities are cached, so you will only see a single call (per RetailServer instance) but if you extend an entity you need to make sure you implement some caching as well if this meets the requirement. For example, fetching an item in the CRT base implementation is cached, so you should only see that call once but if you extended the item with an extension table AND did not use any caching, you will see many calls with the same query during POS operations that require an item lookup. That would indicate that caching should be considered. The caching of a CRT extended entity will be covered in a different blog.
The below trace was taken by adding a single item to a cart (unsorted, so the shown order is the actual execution order). Notice the red marked row. This is the GetItem call of the CRT, and followed the fetch of the item’s extended data. We can clearly see that both of these are only called once, as expected. If this item is being added again within a short period of time, we should not see these SQL traces again.
I can see quite a few similar SQL calls to fetch pricing data, just for adding a single item to a cart. I am not sure why this is, possibly this is something that could be optimized by Microsoft. As a partner/customer, you have full control over the SQL logic in the [ext] schema. Any other issues should be submitted to Microsoft.
Since the data is in format of a SQL table, the data can be easily shared with support or engineers to help with troubleshooting. Simple right click the results header in Management studio/Save Results as/choose CSV file and you are good.
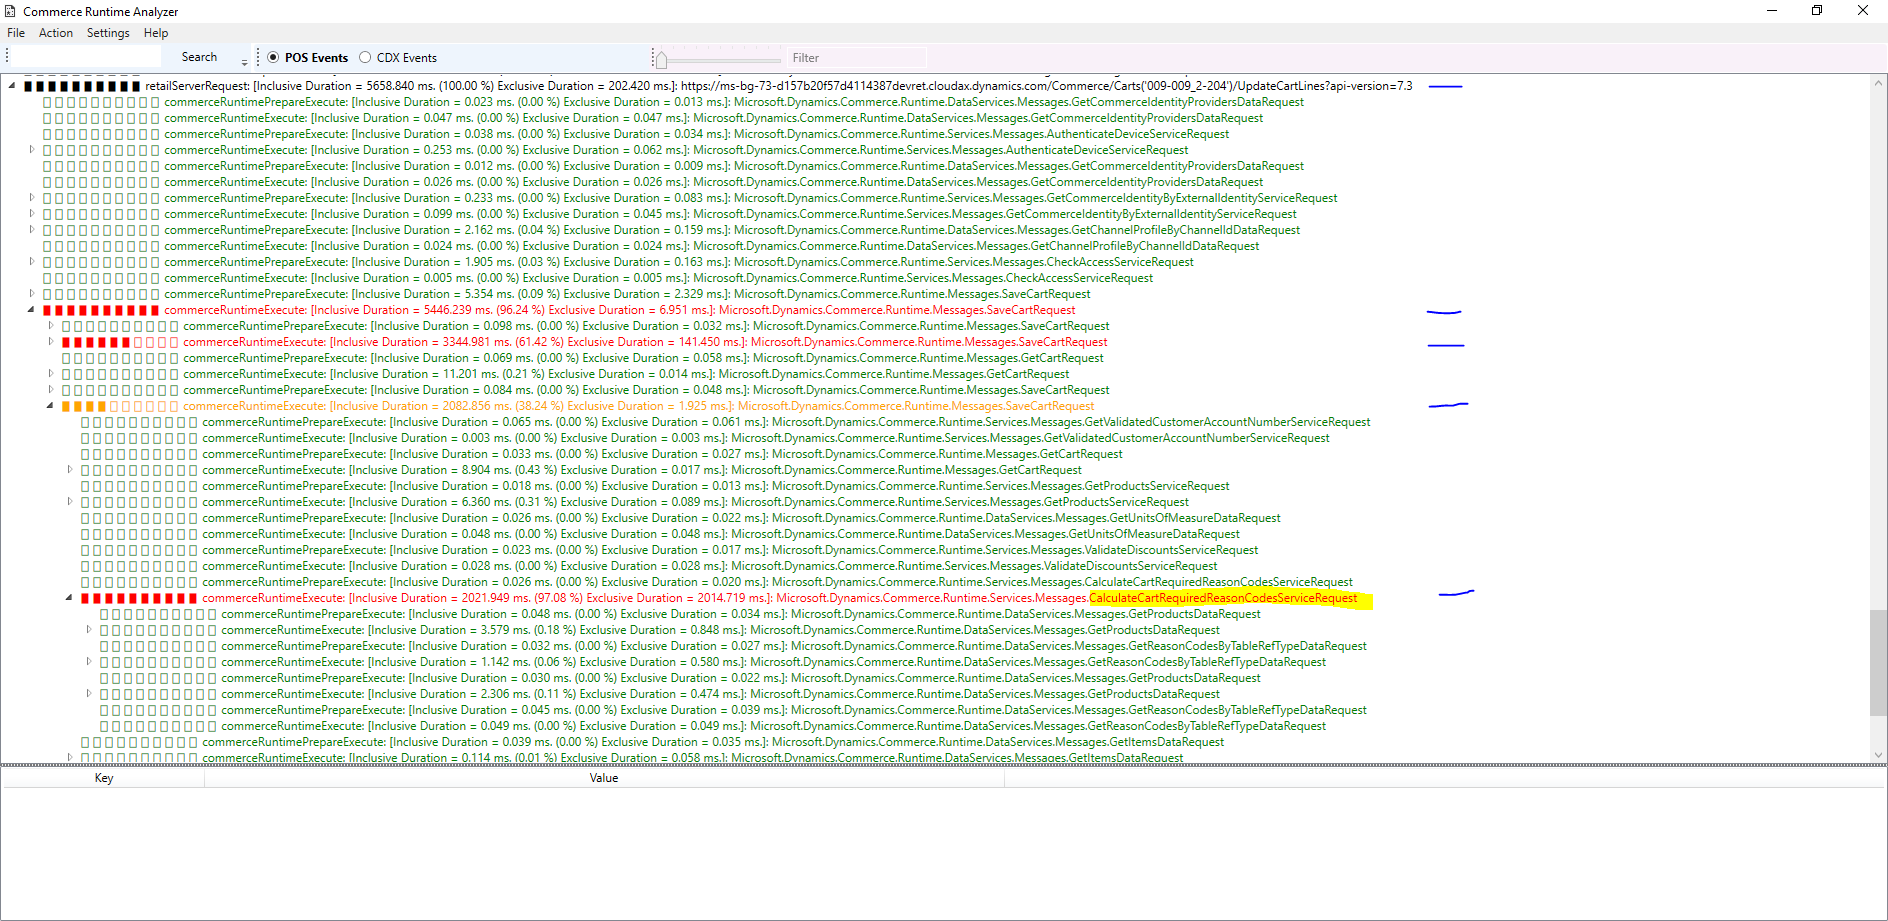
The Retail Product team built a tool that can be used to trace the RetailServer calls, CRT executes, and SQL calls. It shows call-stack like information based on event traces, similarly to the Dynamics 365 Trace Parser. The tool can be used to find slow handlers, slow SQL or just understand what is happening as part of a call.
As usual, a picture says more than 100 words. See my investigation of slow performance of the UpdateCartLines RetailServer call. From that call stack, I can learn this flow includes a lot of other internal steps: get identity, get cart, get products, get unit of measures, calculate reason codes, calculate prices tax, calculate discounts, calculate sales tax, calculate totals, save versioned cart, final saving of the transaction in SQL and much more. This is VERY valuable information and can be obtained with the Commerce Runtime Analyzer WITHOUT reflecting the source code.
I notice that the CalculateCartRequiredReasonCodesServiceRequest takes 2021 ms. When I add up the included child timings, there is a full 2s missing. This is in my own customization (for this sample, I have added a 2s delay in an extended handler).
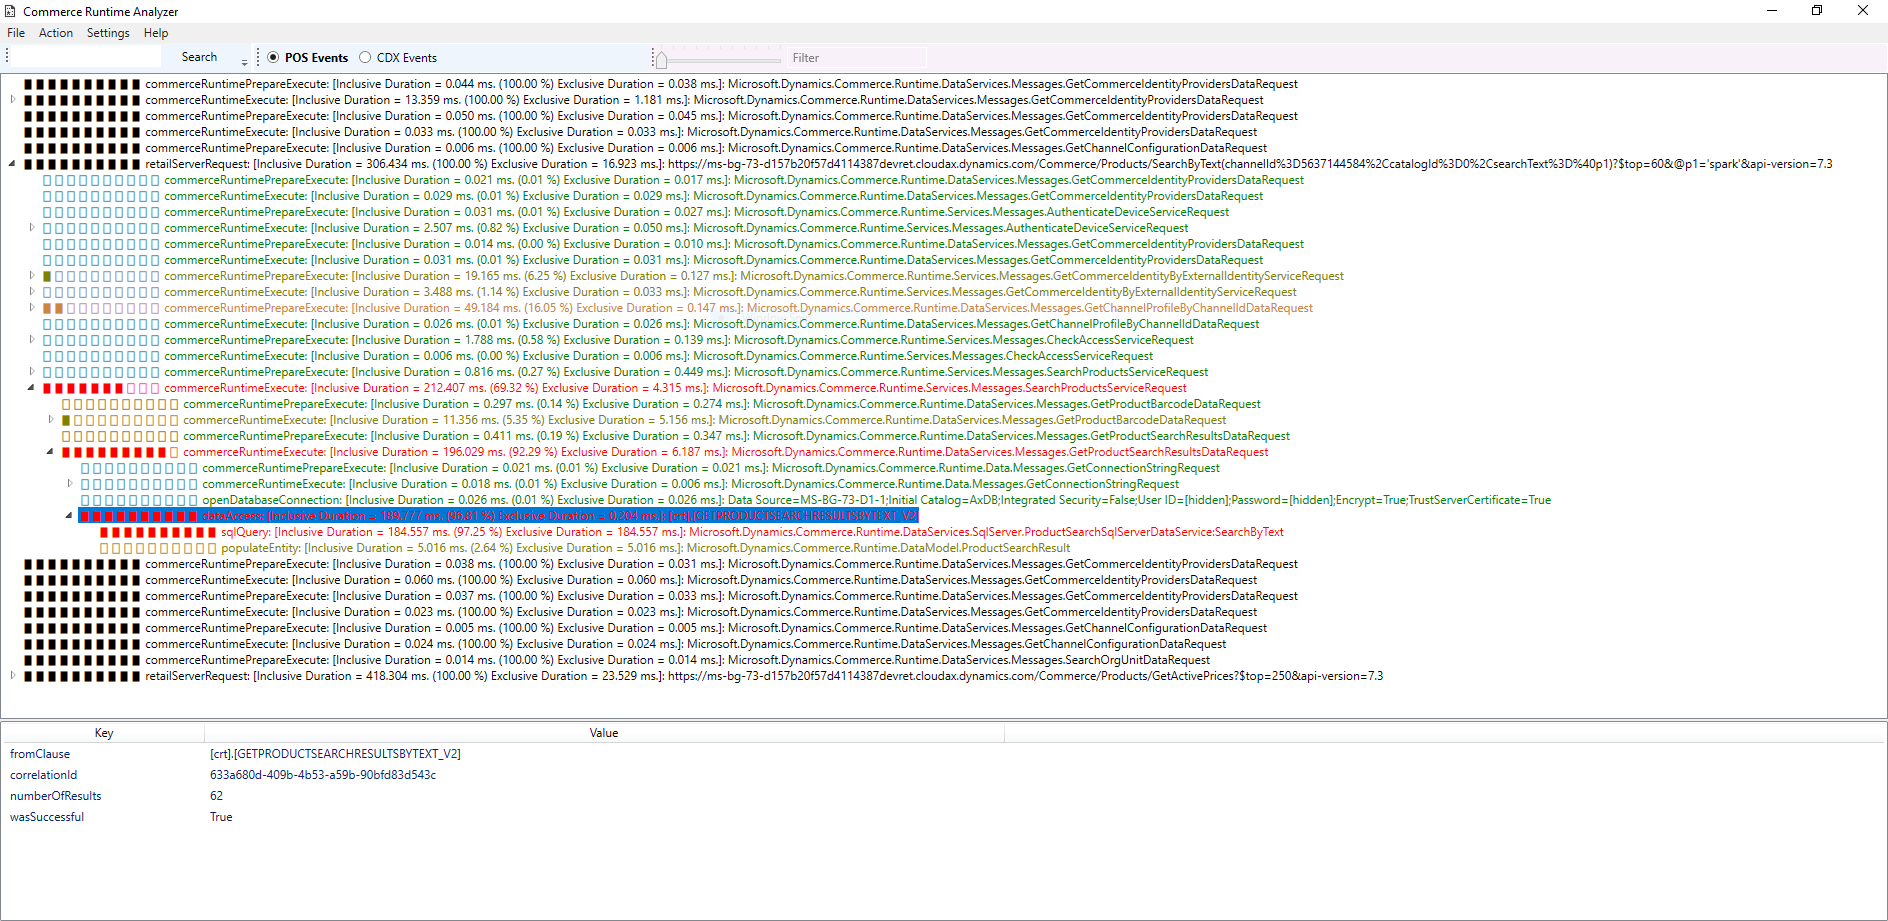
Another scenario is to find out what data the CRT logic is using. I ran a product search and the tool lets me know that the data for the 62 result rows comes from [crt].[GetProductsSearchResultsByText_V2].
The tool is not perfect. At this time, it does not seem to show custom handlers properly. If the Retail team gets enough “requests”, I am sure this could be an easy addition made.
In order to use this tool follow the steps:
1. Ask me for a link of to CommercePerfAnalyzer.zip
2. Unzip and execute the CommercePerfAnalyzer.exe
3. Exercise your scenario
4. Wait a few seconds
5. Inspect the output of the tool
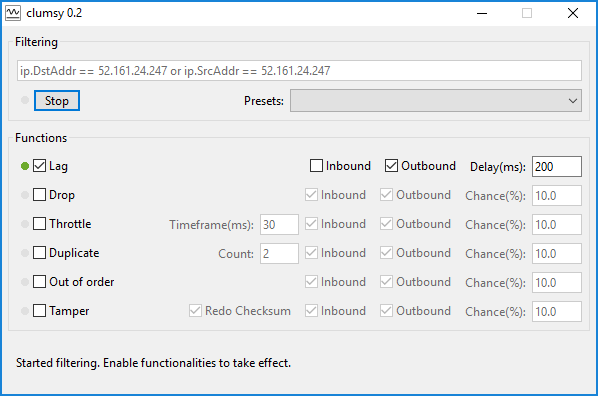
In some cases it is very useful to see how a web site would perform under certain network conditions that are worse than what you have currently. You can use this tool to simulate it: https://jagt.github.io/clumsy/. As an example, if you want to simulate what a network latency of 200ms looks like while using POS, run it on the same computer as POS and configure it with 200ms outbound.
Even if you are on a good network, with this tool you can evaluate what it would look like for someone with higher latency (or other network conditions).
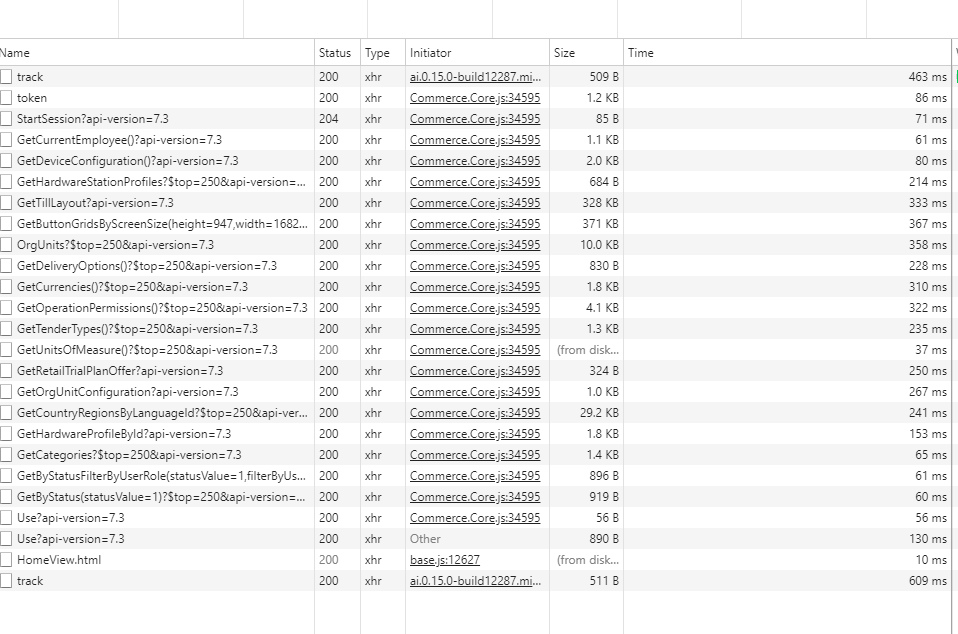
There may be some APIs that “appear” slower than others. To find out, just hit F12 if you are running in the browser or ModernPOS to launch the tool (ModernPOS may require to enable developer mode in Windows).
Running the CloudPOS logon sequence on the same computer that I measured the latency above from, I get these timings:
As you can see, the quickest API calls are all around 60 ms, which makes sense as our measurements above showed an always occurring latency of 41ms.
Depending which scenario is slow, focus on these and see what exact RetailServer call(s) are the culprits. Then move on to the next step to find out why.
By the way, I am not too worried about the time a login takes, as it is usually not a very frequent operation. This may be different for some customers that configure a logoff after each transaction or after a certain time. In general, I would focus on the top 5 customer scenarios.
There is always going to be a physical separation between the server (RetailServer) and client (ModernPOS or CloudPOS browser instance). If this physical distance is large, every RetailServer call will incur a larger additional latency. There is no code change that can fix this, a redeployment of cloud or client components will be needed to lower the value.
Here is how to measure the latency.
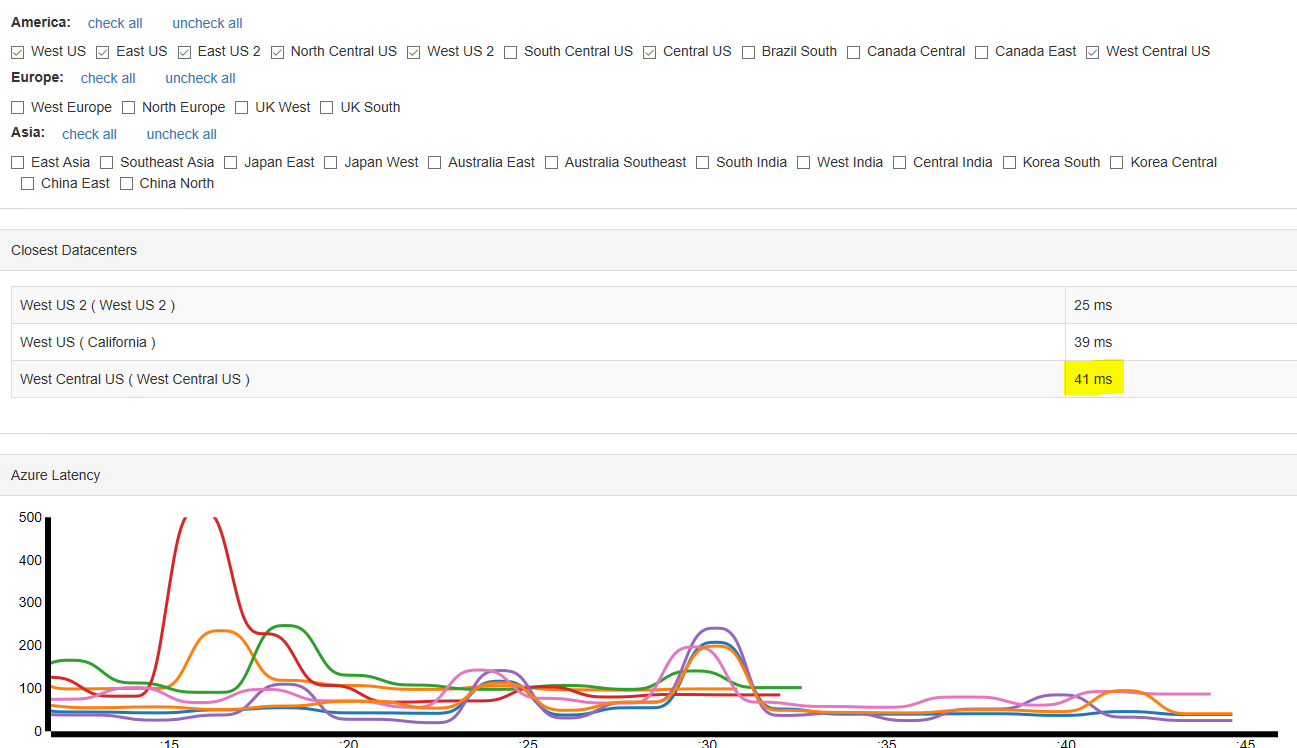
Find out what Azure data center the RetailServer is hosted. Use LCS environment page for the specific environment or ask your IT administrator. For example, my RetailServer is hosted on the Azure primary region “West Central US”.
On the same computer as your store terminal open an internet browser window and browse to http://www.azurespeed.com/. Check at correct Azure region or a few on the same area. The web page will tell you the latency from your computer to the data center the RetailServer is hosted. It is very important to use the same computer as the store terminal, as sometimes customers use a dedicated network for the store terminals and a computer in the back office may be on a different network.
In my example, you can see I get a latency of about 41 ms (for every RetailServer call). That is a very good value (for this particular single store, it may have been better to use “West US 2” to get an even better response). Off course the choice should be balanced between all different stores that use this RetailServer instance.
If you want to further investigate where a latency issue occurs, you may use other networking utilities. For example tracert (http://www.mediacollege.com/internet/troubleshooter/traceroute.html). It will list all the routers it passes through until it reaches its destination, or fails to and is discarded. In addition to this, it will tell you how long each ‘hop’ from router to router takes.
Note that Azure does not seem to allow ICMP packets through, but tracert and ping can still be used to get a sense of what the issues are outside of the data center.
A real certificate should be used to code sign the ModernPOS packages. That will allow for more security and simpler deployments (as no self-signed certs will need to be installed before installing MPOS).
Since the real certificate is usually not accessible by all developers in the team (and should not be), non-official builds will keep using a simple self-signed cert, i.e. the Contoso certificate shipped with the Retail Sdk.
Additionally, recent releases of MPOS, RetailServer, and Dynamics AX use AAD app ids for proper authorization. A onetime setup in AAD and AX is needed. With the proper setup, we configure AX to only allow access from ModernPOS clients that claim the correct app id combination.
Note, that there is a direct relation between the signing certificate, the reply address of the final built ModernPOS and the AAD app id.
With these recent changes, non-production environments can be configured to allow both the real and self-signed ModernPOS clients to access. However, the actual production environment should only allow access by MPOS clients with real certs and self-signed certs should not be allowed.
An automatic benefit of this is that it cannot happen, that a developer connects by accident to production during development phase.
Note, that all the steps below have to be carried out once per tenant, and not per environment.
Detailed steps
Ideally, the following steps should be carried out after a dev environment is fully working with a self-signed cert. That ensures that AX is correctly setup (workers, stores, registers, etc.).
1. Build server setup
The first step is to install a real certificate on the build server so that the Retail Sdk build can use it.
Note, that the steps below require administrative access to the build server. Therefore a cloud-hosted build server is required (as opposed to a Microsoft-hosted build server without administrative privileges is not possible to be used). This is unfortunate, and Microsoft is working on a solution.
On the build machine, find the Windows service for the build and change the user account it runs under to Administrator. It is usually set to “NT Authority”.
On the build machine, install your company’s appx signing certificate into the build accounts user certificate store. A certificate password may be needed to do this. Mark the certificate as not exportable. Make a note of the certificate’s thumbprint. We will need it later.
2. Initial Retail Sdk setup
We want to use the certificate in Release builds (official) but keep using the Contoso signing cert for dev purposes in Debug builds. Other strategies can be used, but using the build flavor has worked well for some. The RetailSdk allows us to provide either a path to a certificate or a certificate thumbprint. We will use the first approach for the self-signed test certificate and the 2nd approach for the real certificate. We can use simple MSbuild logic to switch between the two. Below is an example how to do that. This change would have to be made to the RetailSdk’s customization.settings or better, to a global.props file sitting next to it with all customer values. Use the thumbprint from the step above.
<!– Release builds pick up the secure cert from the build server with named thumbprint, Debug builds use the test cert part of the Retail Sdk –> <ModernPOSPackageCertificateKeyFile Condition=”‘$(ModernPOSPackageCertificateKeyFile)’ == ” and ‘$(Configuration)’ != ‘Release'”>$(MSBuildThisFileDirectory)\ModernPOSAppxSigningCert-Contoso.pfx</ModernPOSPackageCertificateKeyFile> <ModernPOSPackageCertificateThumbprint Condition=”‘$(ModernPOSPackageCertificateThumbprint)’ == ” and ‘$(Configuration)’ == ‘Release'”>22aa3bdca99b70d4ca44d0c51d23a07e06fcfc61</ModernPOSPackageCertificateThumbprint>
The final changes to the dllhost.exe.config you had to make in step 3 should be added to the RetailSdk\Assets\dllhost.exe.config file. That way, any new and officially build ModernPOS will automatically have the right app id information configured.
Note: For development purposes, the older app id information must be used. This can be easily done by leaving the original settings in the config file, but leave them commented out. Switching between the production and dev ModernPOS is that as easy as un-commenting the developer values before activating MPOS.
Note: Implemented with Dynamics 365 version 7.2.11792.62628, or App Update 4 (should work with many other versions). Sample code can be downloaded at the end of this blog.
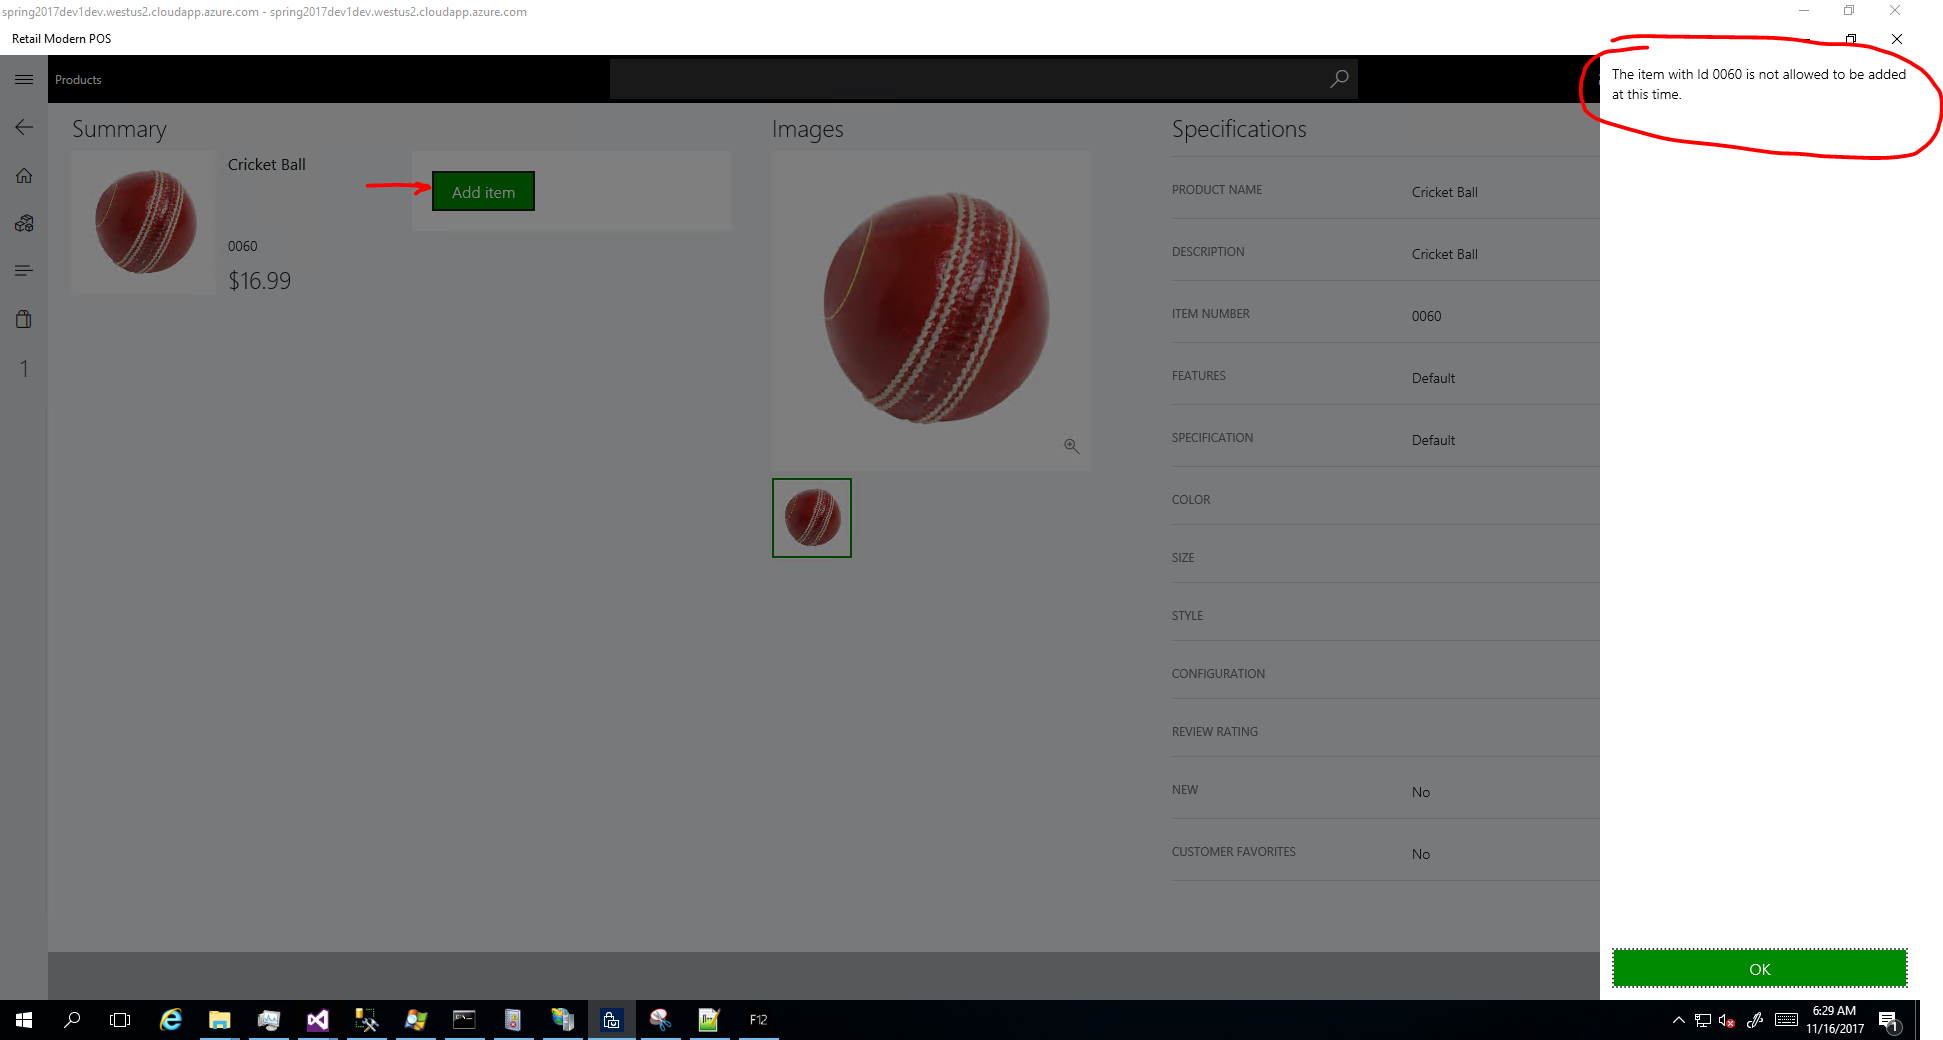
Imagine there is some additional business logic that should be executed during “AddToCart” in order to cancel the operation and show a dialog in POS (both ModernPOS or CloudPOS). It could be that an external system has some additional information about item availability, or it could be a credit check that the customer on the transaction failed. Whatever the actual business logic may be, our code extension shall meet these goals:
If a certain condition is true, do not persist the new cart item,
show a well-formed, localized error message in POS about the issue, and
keep the existing POS view open, with unchanged data, after the dialog is closed.
This can be accomplished with a very small extension in CRT and without any changes in POS. The CRT request in charge of saving the cart data is “SaveCartVersionedDataRequest”. All we need to do is to augment the CRT request with a pre-trigger that will give us the opportunity to “cancel” before saving the cart. Steps:
Create a simple new CRT trigger and implement the interface methods
    class MyAddToCartLineValidationTrigger : IRequestTrigger
    {
        public IEnumerable SupportedRequestTypes
        {
            get
            {
                return new[] {
                    typeof(SaveCartVersionedDataRequest),
                };
            }
        }

        public void OnExecuted(Request request, Response response)
        {
        }

        public void OnExecuting(Request request)
add business logic to validate any data on the cart or transaction
if you need to invalidate/cancel the “AddToCart” because the business rules call for it, throw a CommerceException with localized message
                if (invalidCart)
                {
                    throw new CommerceException("Microsoft_Dynamics_Commerce_30104", "Custom error")
                    {
                        LocalizedMessage = string.Format("The item with Id {0} is not allowed to be added at this time.", disallowedItemId),
                        LocalizedMessageParameters = new object[] { disallowedItemId }
                    };
                }
Add your changes to the Retail Sdk, edit the commerceruntime.exe.config, global.prop or Customization.settings files