Anyone who has troubleshooted a production environment with diagnostics traces in order to understand why a certain operation did something unexpected knows that it can be quite difficult. Anyone who also had to find not enough traces were available will agree that it would have been great if they had just spent the time to do it right…
So, if you have not yet, let’s do it right this time.
There are 2 logging-related topics I want to discuss first with regards to tracing in the Commerce CSU.
Operational Insights
Operational Insights. Enabling it will allow you to see almost as much as Microsoft. You can check on slow queries, long running operations, errors, count how many Checkouts you had and so on. The following screen shot is from a dashboard that uses the Operational Insights data from a performance environment. It’s very easy to see what the slowest SQL statements are.

Details about how to use the data is something for another blog.
Extension code instrumentation
Instrument your extension code for Application Insights. When a customer or partner extends the Commerce functionality, Microsoft recommends to properly instrument the extension code with logging statements. The documentation includes a simple class that can be used for logging. Once done and the code is deployed, it will emit traces that look like this:
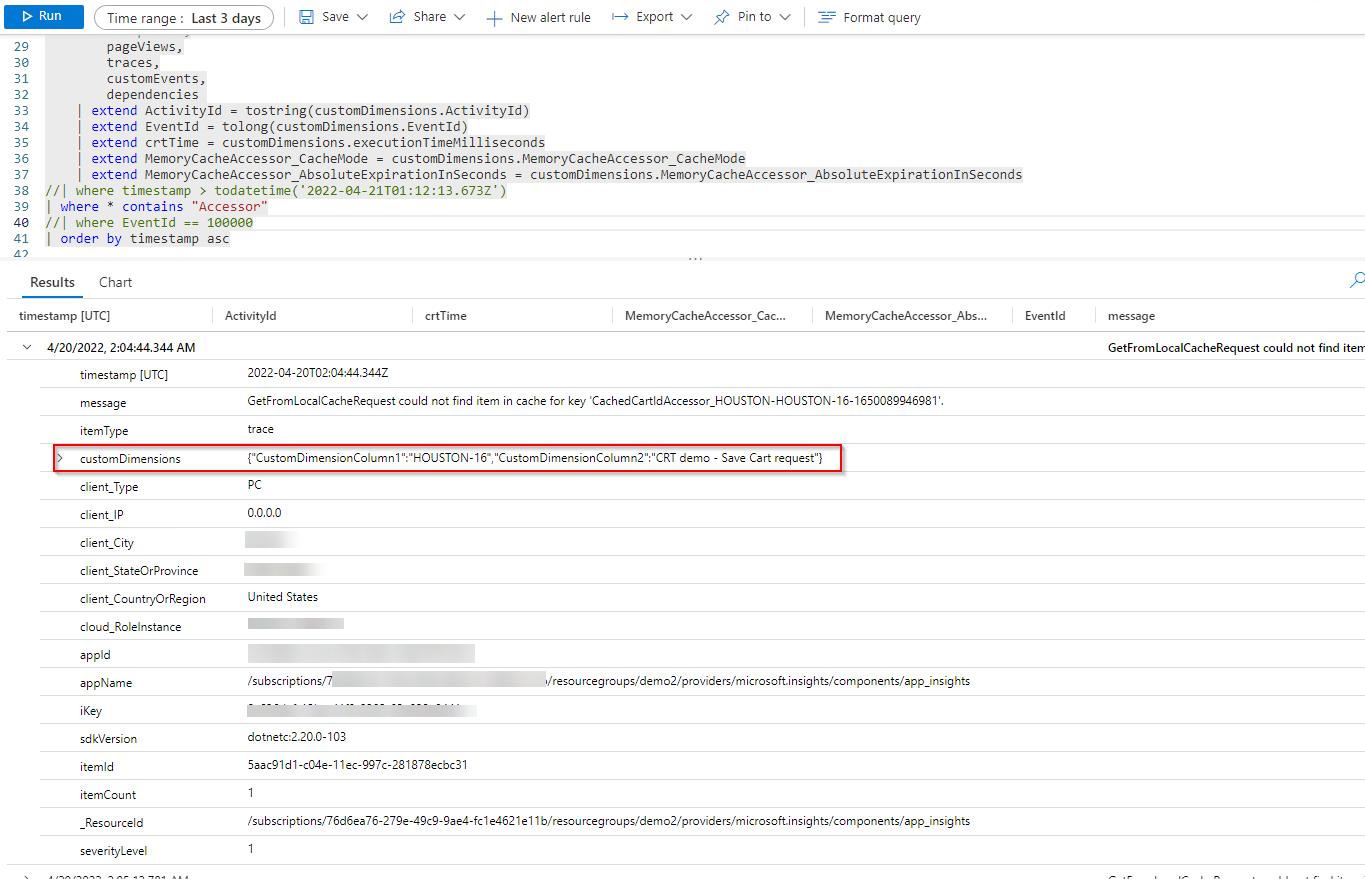
I have highlighted the customDimension property in red. It is an important piece of information as we have the capability to put anything into the trace for later querying.
Improving the logger class
Any out-of-the-box trace that comes from the CSU has many data inside customDimension. The ones that are very useful to filter or correlate with while querying Application Insights (with Kusto language) are highlighted below in yellow:
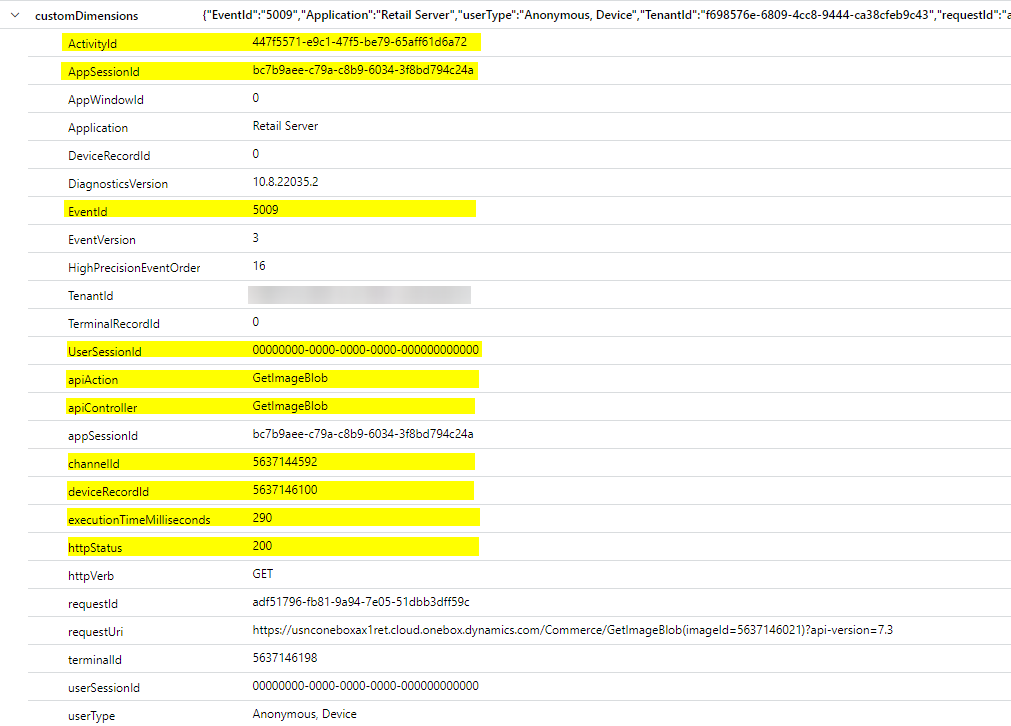
The concept of an ActivityId allows you to query for all traces that occurred as part of one request.
AppSessionId is for all data from a terminal.
UserSessionId is unique for each logged in user.
There are many more that are pretty self-explanatory.
I was able to improve the simple logging class that Microsoft provides in such a way that customDimensions holds more meaningful information. In the screen shot below you can see that many of the out-of-box experience (OOBE) properties are now included in the custom trace.
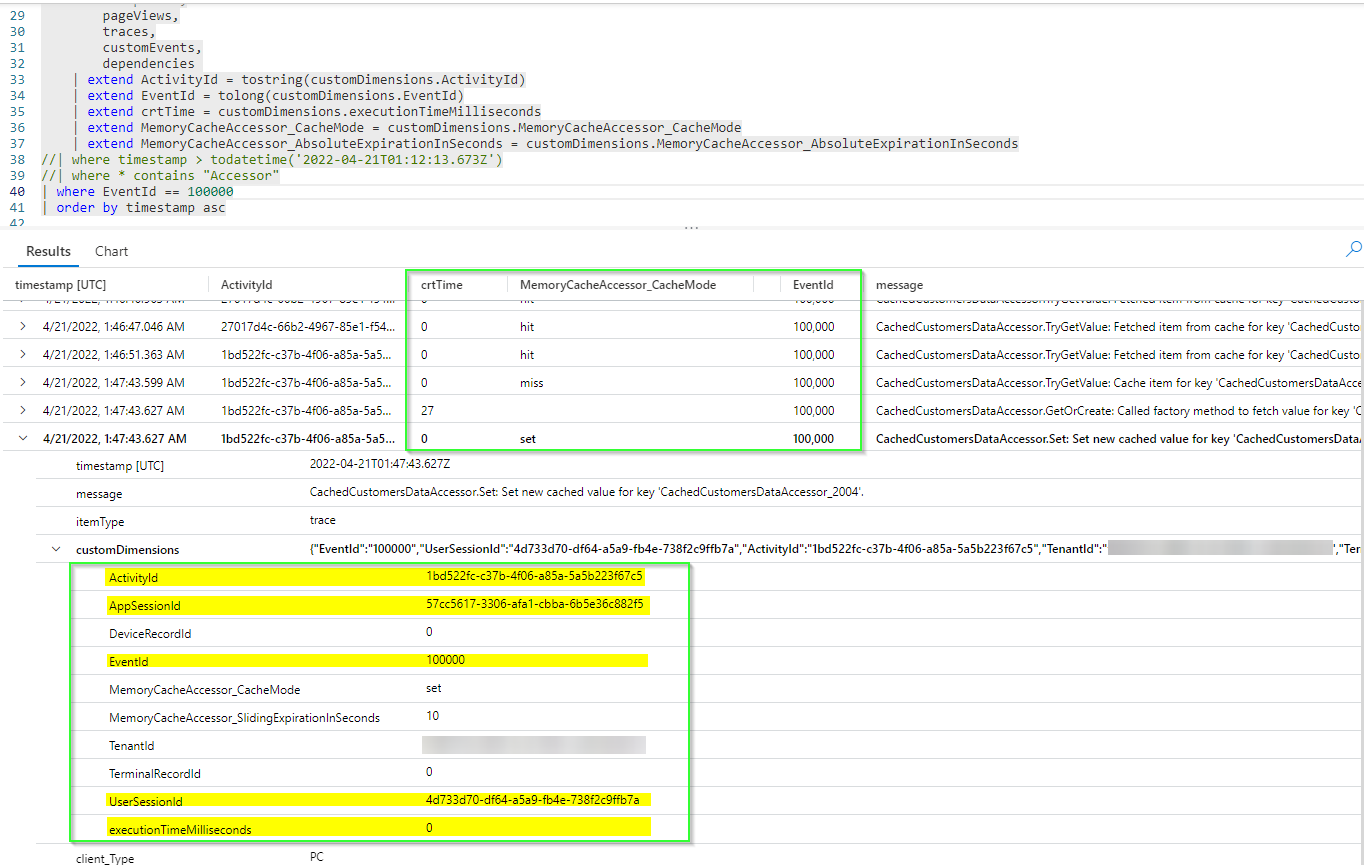
Once we instrument the code (in places where it would aid troubleshooting), we have a great chance to find issues just by looking into the Application Insights store. The code to write a trace is simple:
var logger = Logger.GetLogger(request.RequestContext);
var trace = logger.CreateTraceWithSessionContext(SeverityLevel.Information);
trace.Properties.Add("executionTimeMilliseconds", stopwatch.ElapsedMilliseconds.ToString(CultureInfo.InvariantCulture));
trace.Properties.Add("EventId", "100000");
trace.Message = "Some message";
logger.TrackTrace(trace);
Feel free to take a look or use the logger for your project at your own risk. Let me know if you find any bugs. It is ready to go for a Dynamics 365 CRT extension project based on the latest Commerce SDK.
I am looking forward to a future release when Microsoft supports sending traces from Dynamics 365 Finance and SCM to Applications Insights as well.
Thanks.