This post originally appeared on https://dynamicsnotes.com/profiling-channel-database-sql-queries/.
The information below is not particular to the Retail Channel or Dynamics 365 F&E databases. It can be used on any SQL database.
Monitoring performance by using the Query Store
Find bad performing queries, missing indexes, changed query performance with the Query Store. More information can be found here:
Monitoring performance by using the Query Store
Monitoring performance by using the SQL Profiler
SQL Profiler can be used to inspect and trace and measure all SQL access. Compared to the Query Store, SQL Profiler provides data that is “less prepared”. However, in some cases that is what’s needed. Follow these steps:
- Start SQL Server Profiler and connect to the Channel database to be profiled
- Start a new trace with default configuration (and hit Run)
- Rerun the scenario for which you want to profile the SQL access
- Stop the trace
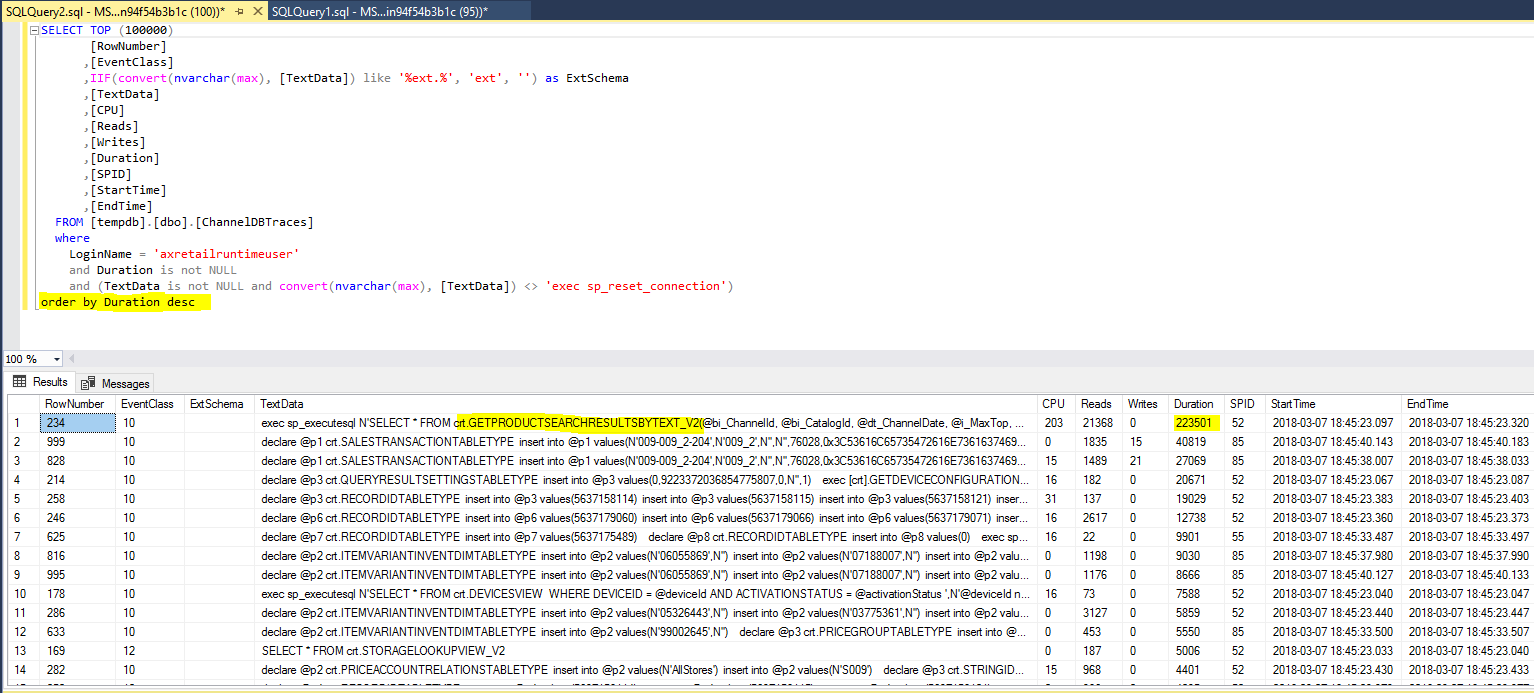
- In SQL Server Profiler, hit File/Save As/Trace Table and save the trace data to a new table, i.e. into tempdb.ChannelDbTraces
- Using SQL Server Management Studio, query the trace table
SELECT [rownumber],
       [eventclass],
       Iif(( CONVERT(NVARCHAR(max), [textdata]) LIKE '% [[]ext%' )
            OR ( CONVERT(NVARCHAR(max), [textdata]) LIKE '% ext%' ), 'ext', '')
       AS
       ExtSchema,
       [textdata],
       [cpu],
       [reads],
       [writes],
       [duration],
       [spid],
       [starttime],
       [endtime]
FROM   [tempdb].[dbo].[channeldbtraces]
WHERE  loginname = 'axretailruntimeuser'
       AND duration IS NOT NULL
       AND ( textdata IS NOT NULL
             AND CONVERT(NVARCHAR(max), [textdata]) <>
                 'exec sp_reset_connection' )
       AND Iif(( CONVERT(NVARCHAR(max), [textdata]) LIKE '% [[]ext%' )
                OR ( CONVERT(NVARCHAR(max), [textdata]) LIKE '% ext%' ), 'ext',
           '') =
           'ext'
ORDER  BY duration DESC
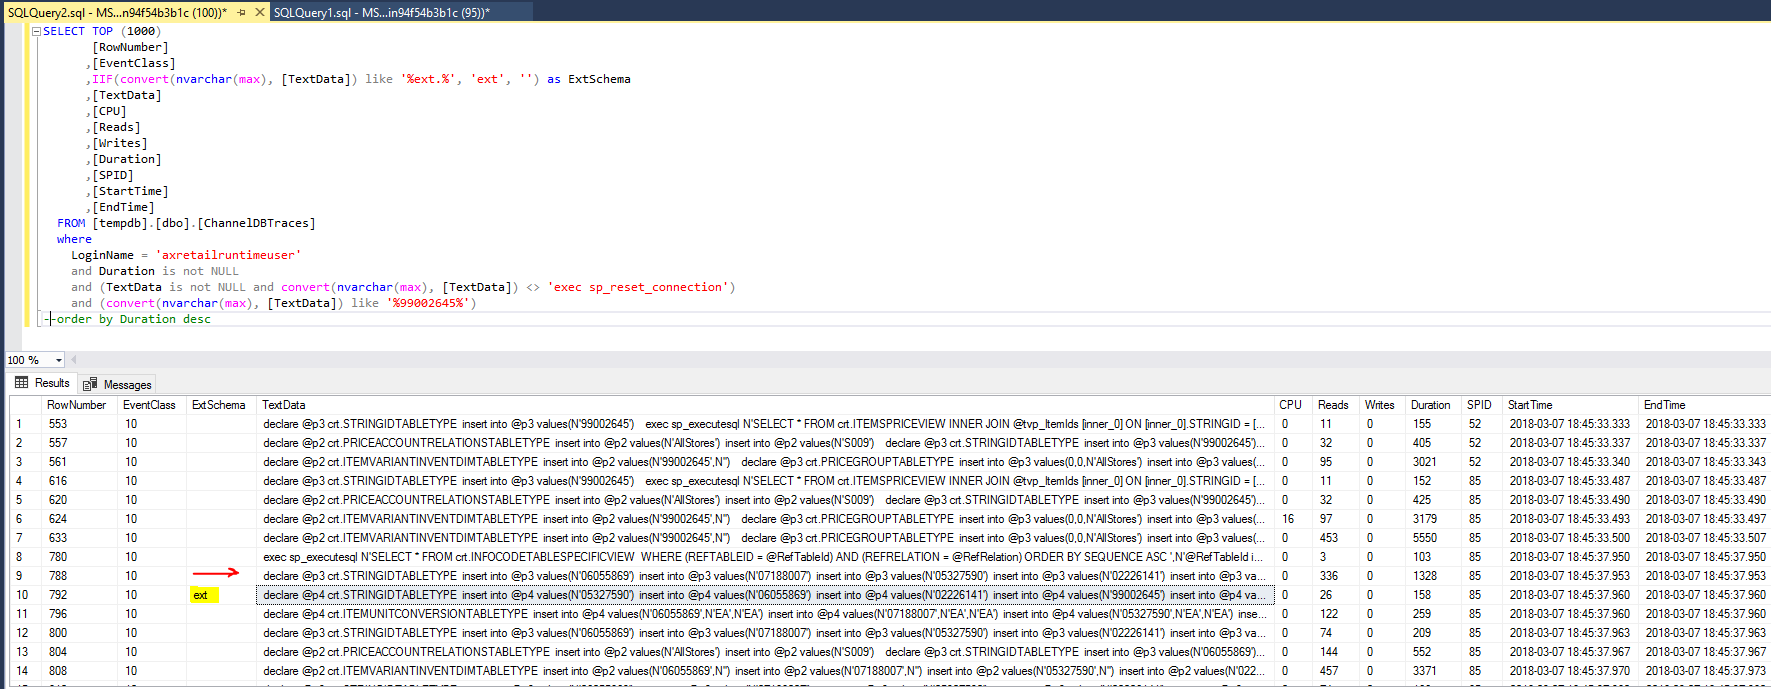
Useful query scenarios:
- Longest SQL queries: add order clause “order by Duration desc”. By the way, the Duration columns unit is microseconds.
- Include only extended SQL queries: add filter clause “and IIF((convert(nvarchar(max), [TextData]) like ‘% [[]ext%’) or (convert(nvarchar(max), [TextData]) like ‘% ext%’), ‘ext’, ”) = ‘ext’” (in 7.2 and later, any custom SQL has to be implemented in the [ext] database schema.)
- Find any queries that are called multiple times and order by the number of calls, and execution times. This may help to find out if caching mechanisms could be applied to optimize Microsoft or custom code.
SELECT count(CONVERT(NVARCHAR(max), [textdata])) CountOfExcecutes,
       CONVERT(NVARCHAR(max), [textdata])  as SQLStatement, sum(duration) SUMOfDuration, avg(duration) AVGOfDuration
FROM   [tempdb].[dbo].[ChannelDbTraces]
WHERE  loginname = 'axretailruntimeuser'
       AND duration IS NOT NULL
       AND ( textdata IS NOT NULL
             AND CONVERT(NVARCHAR(max), [textdata]) <>
                 'exec sp_reset_connection' )
group by CONVERT(NVARCHAR(max), [textdata])
order by count(CONVERT(NVARCHAR(max), [textdata])) desc, sum(duration) desc
Looking at these SQL traces can reveal issues with inadequate tracing. Some CRT base entities are cached, so you will only see a single call (per RetailServer instance) but if you extend an entity you need to make sure you implement some caching as well if this meets the requirement. For example, fetching an item in the CRT base implementation is cached, so you should only see that call once but if you extended the item with an extension table AND did not use any caching, you will see many calls with the same query during POS operations that require an item lookup. That would indicate that caching should be considered. The caching of a CRT extended entity will be covered in a different blog.
The below trace was taken by adding a single item to a cart (unsorted, so the shown order is the actual execution order). Notice the red marked row. This is the GetItem call of the CRT, and followed the fetch of the item’s extended data. We can clearly see that both of these are only called once, as expected. If this item is being added again within a short period of time, we should not see these SQL traces again.
I can see quite a few similar SQL calls to fetch pricing data, just for adding a single item to a cart. I am not sure why this is, possibly this is something that could be optimized by Microsoft. As a partner/customer, you have full control over the SQL logic in the [ext] schema. Any other issues should be submitted to Microsoft.
Since the data is in format of a SQL table, the data can be easily shared with support or engineers to help with troubleshooting. Simple right click the results header in Management studio/Save Results as/choose CSV file and you are good.
One thought on “Profiling Channel database SQL queries”