Operations Insights for the Commerce is now generally available and provides a wealth of telemetric information. After enabling and configuring it, every RetailServer API call and SQL query is being logged to the customer’s Azure Application Insights, no matter whether it is coming from out-of-box or extension code. The extend of the information is comparable with what is available to Microsoft’s product and support teams, including the execution time of these operations in milliseconds. This proves to be a treasure trove of information for customers and implementation partners to understand better what is happening inside the CSU. Azure provides different tools to “look” into this data which are based on the Kusto query language ((TODO: add link)). These are well documented.
While querying the data yourself proves useful for many cases, it is lacking a high-level view. While working on a Commerce implementation project recently, I have build a Azure’s data explorer dashboard to provide this high-level view. After receiving great feedback from my team and since it took a few iterations to get the Kusto queries right, I have been able to “re-create” the dashboard for another Commerce implementation in under 15 minutes. I am providing a step-by-step manual on how do do that so other’s can use it in their implementations as well.
See a screen shot of the dashboard below: (TODO: add link)
If you have any feedback, corrections or additional implementation ideas please let me know.
Note: Only CSU telemetry is currently supported, but POS, HardwareStation and even the Dynamics 365 Finance and SCM traces are planned for the future.
Creation
First, enable Operations Insights in F&SCM and verify that the telemetry data is flowing (ToDO add link).
Add the cluster
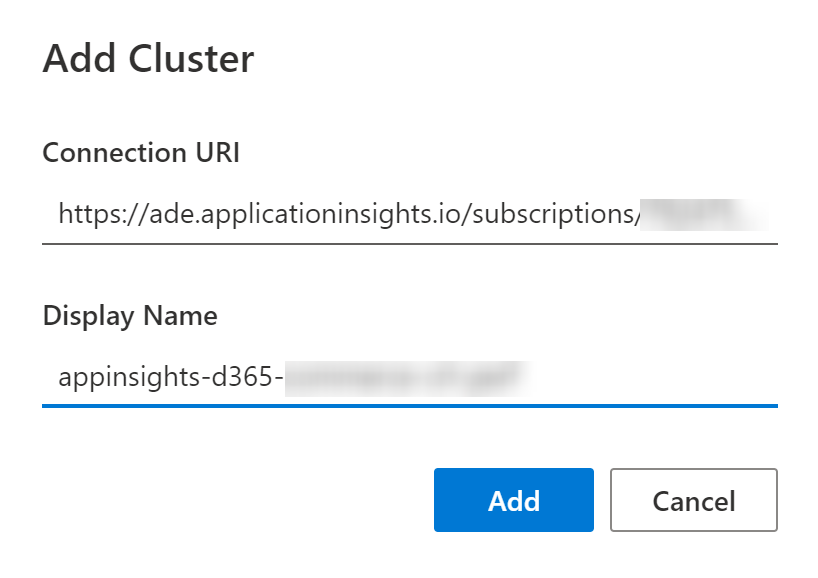
Go to https://dataexplorer.azure.com/clusters/ and select Add Cluster. Then configure the dialog as below:
The connection URI should have the following format:
Note that the above URI needs to be edited for correct subscription Id, resource group name and application insights names.
Add the dashboard and data source
Create a new Azure Data Explorer dashboard at (todo add link……….. https://dataexplorer.azure.com/dashboards)
Add a new dashboard at https://dataexplorer.azure.com/dashboards
On the new dashboard, click the top right down-caret, pick Data Sources and click Create new data source
Enter the same URI that you used for the cluster above, and give it a prescriptive name. Note: Make sure the URI is proper, copying and pasting in this dialog is a little difficult
Click Connect and select the data source. If it did not find the data source, the URI is incorrect.
Save the dashboard before continuing.
Create the [@] Parameters
Click the [@] Parameters link
A “Time range” parameter will already be pre-configured, and we will keep it as is
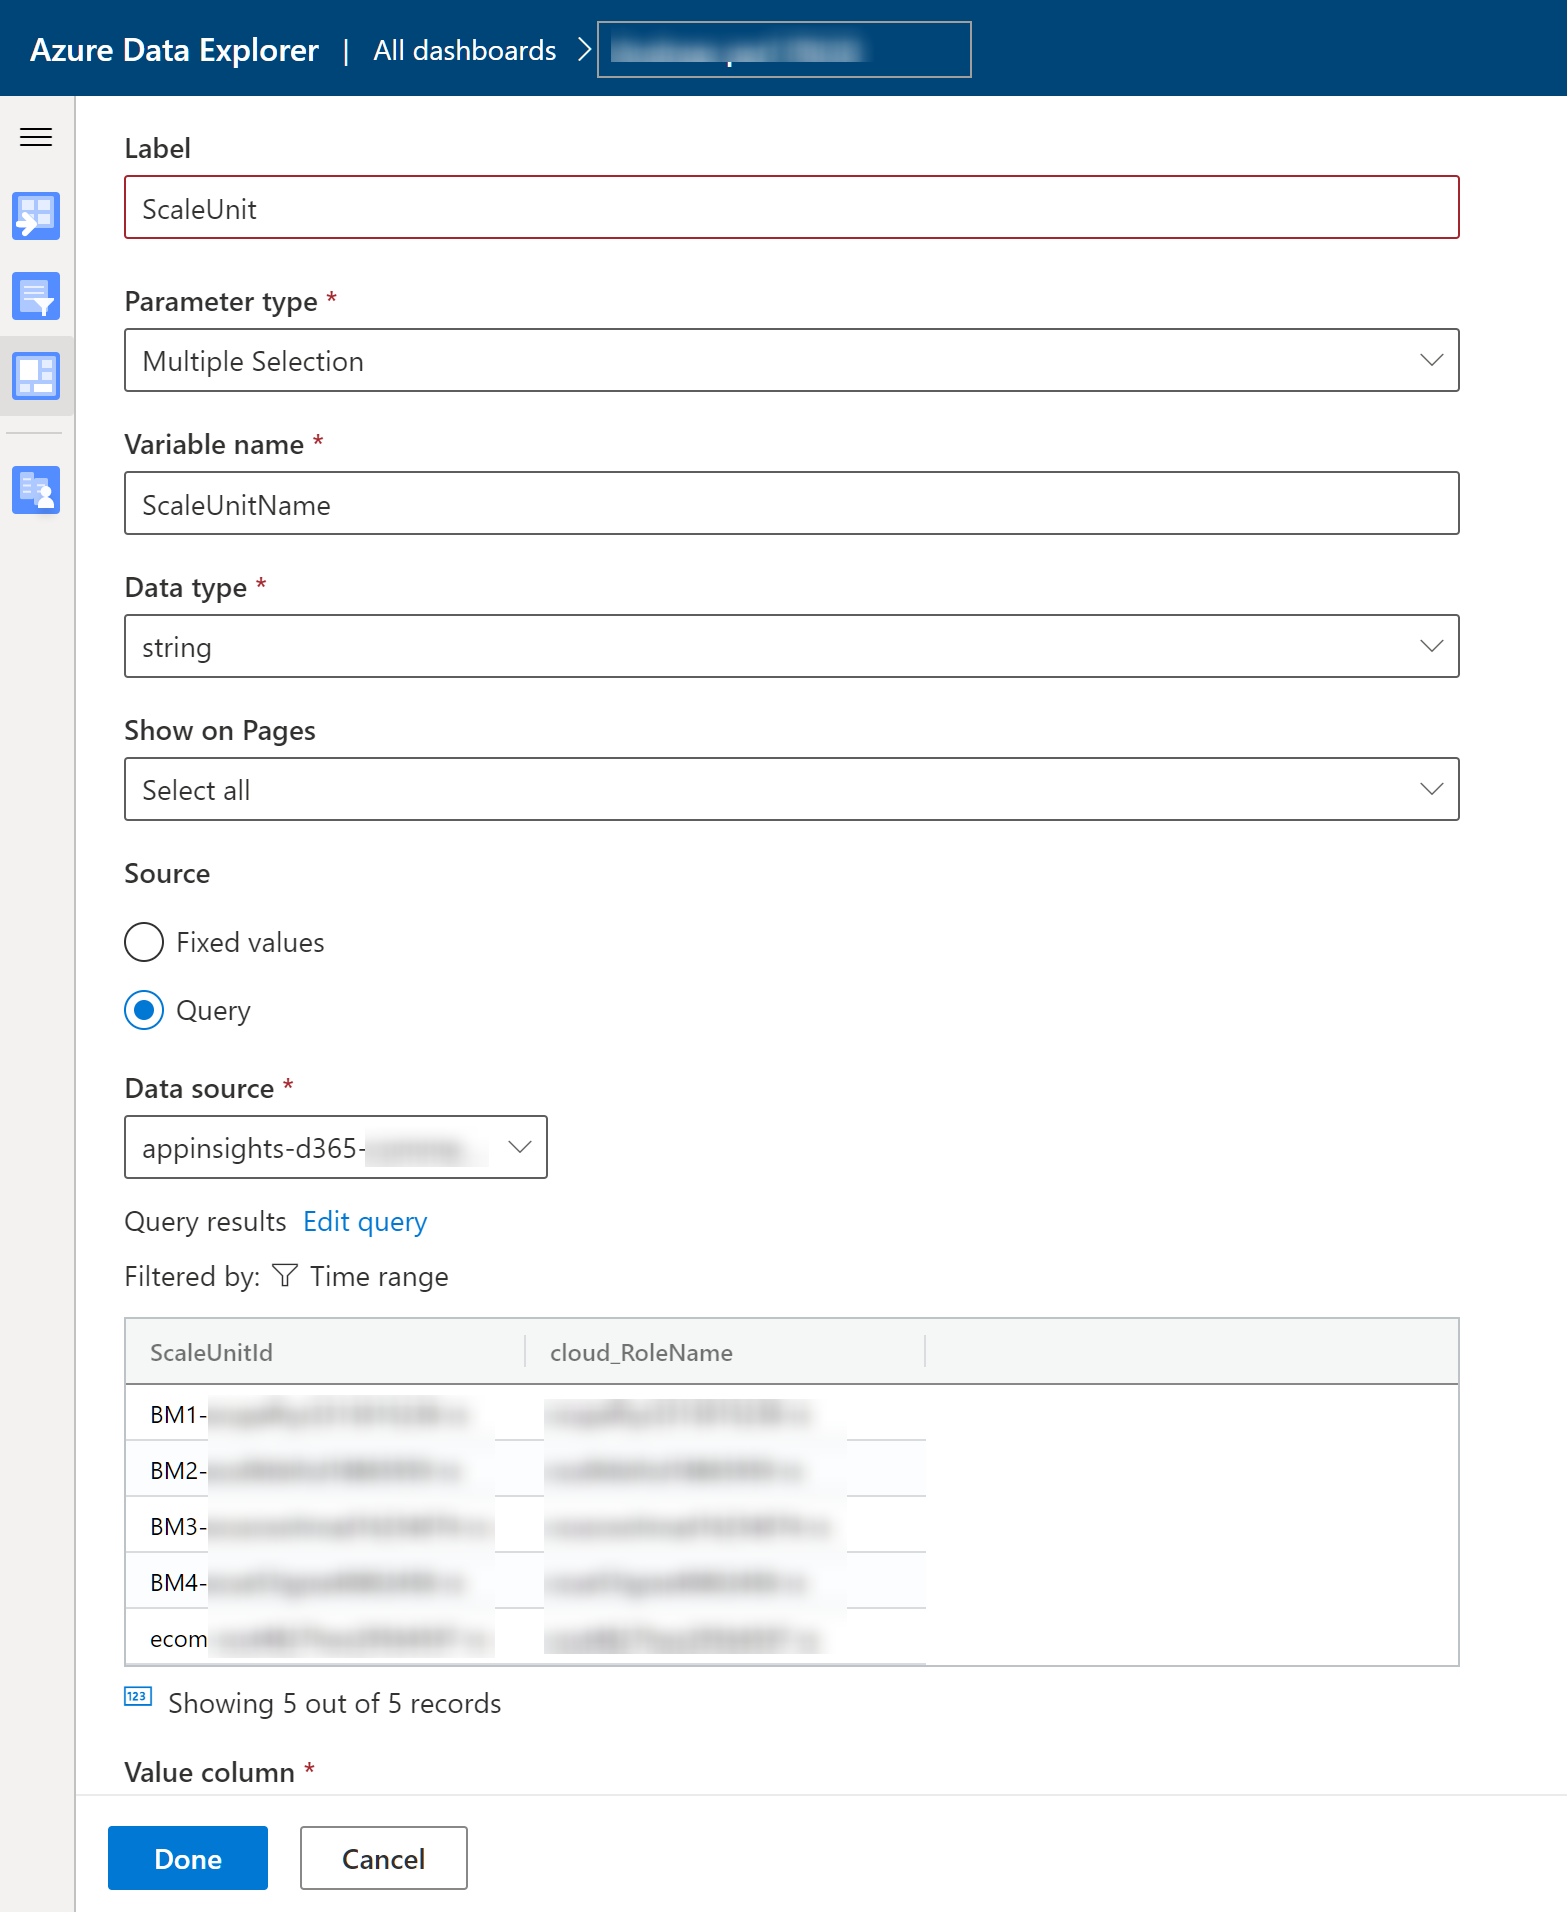
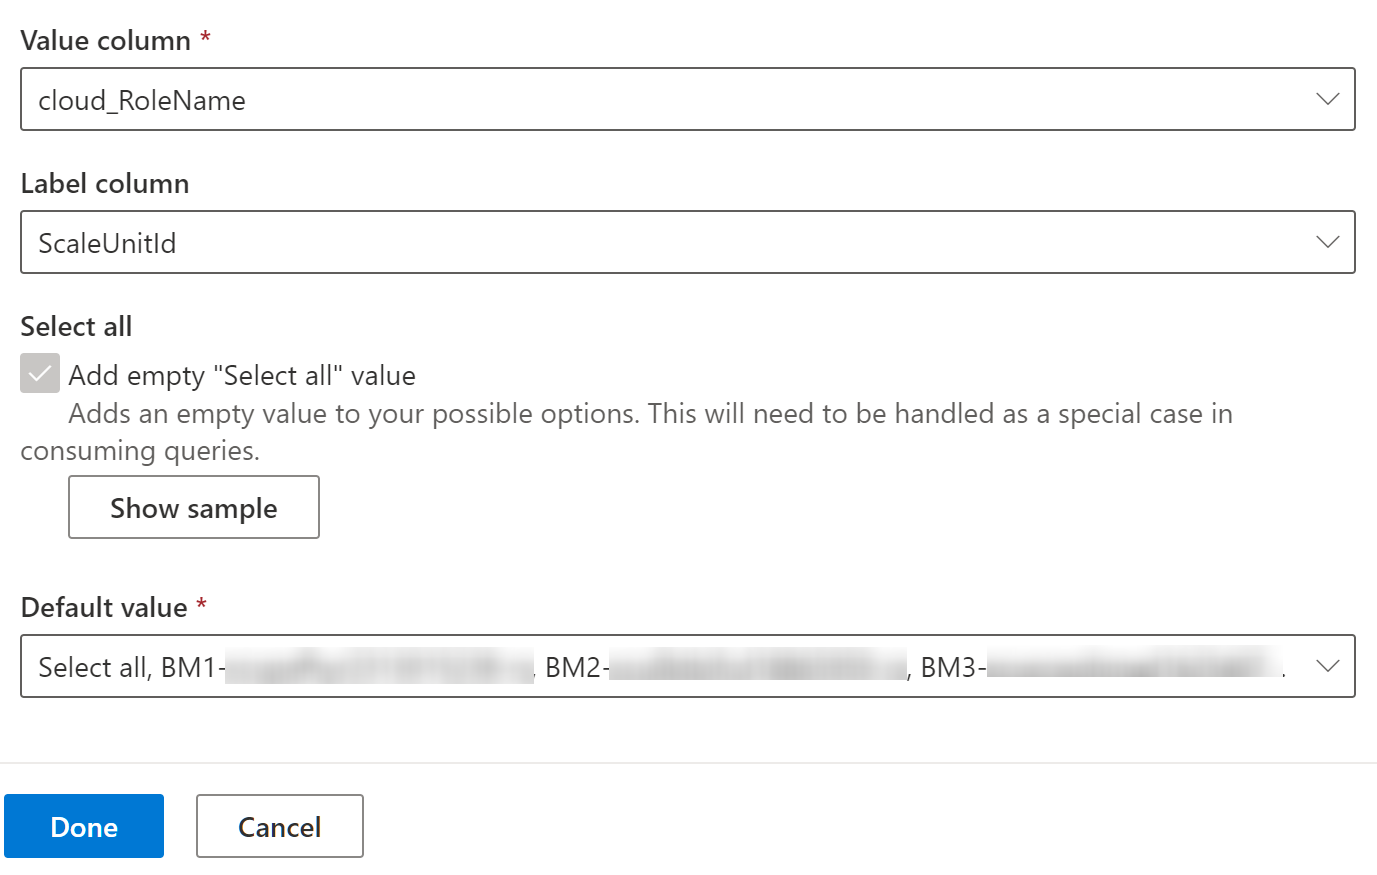
Create a new parameter “ScaleUnit”. See details below
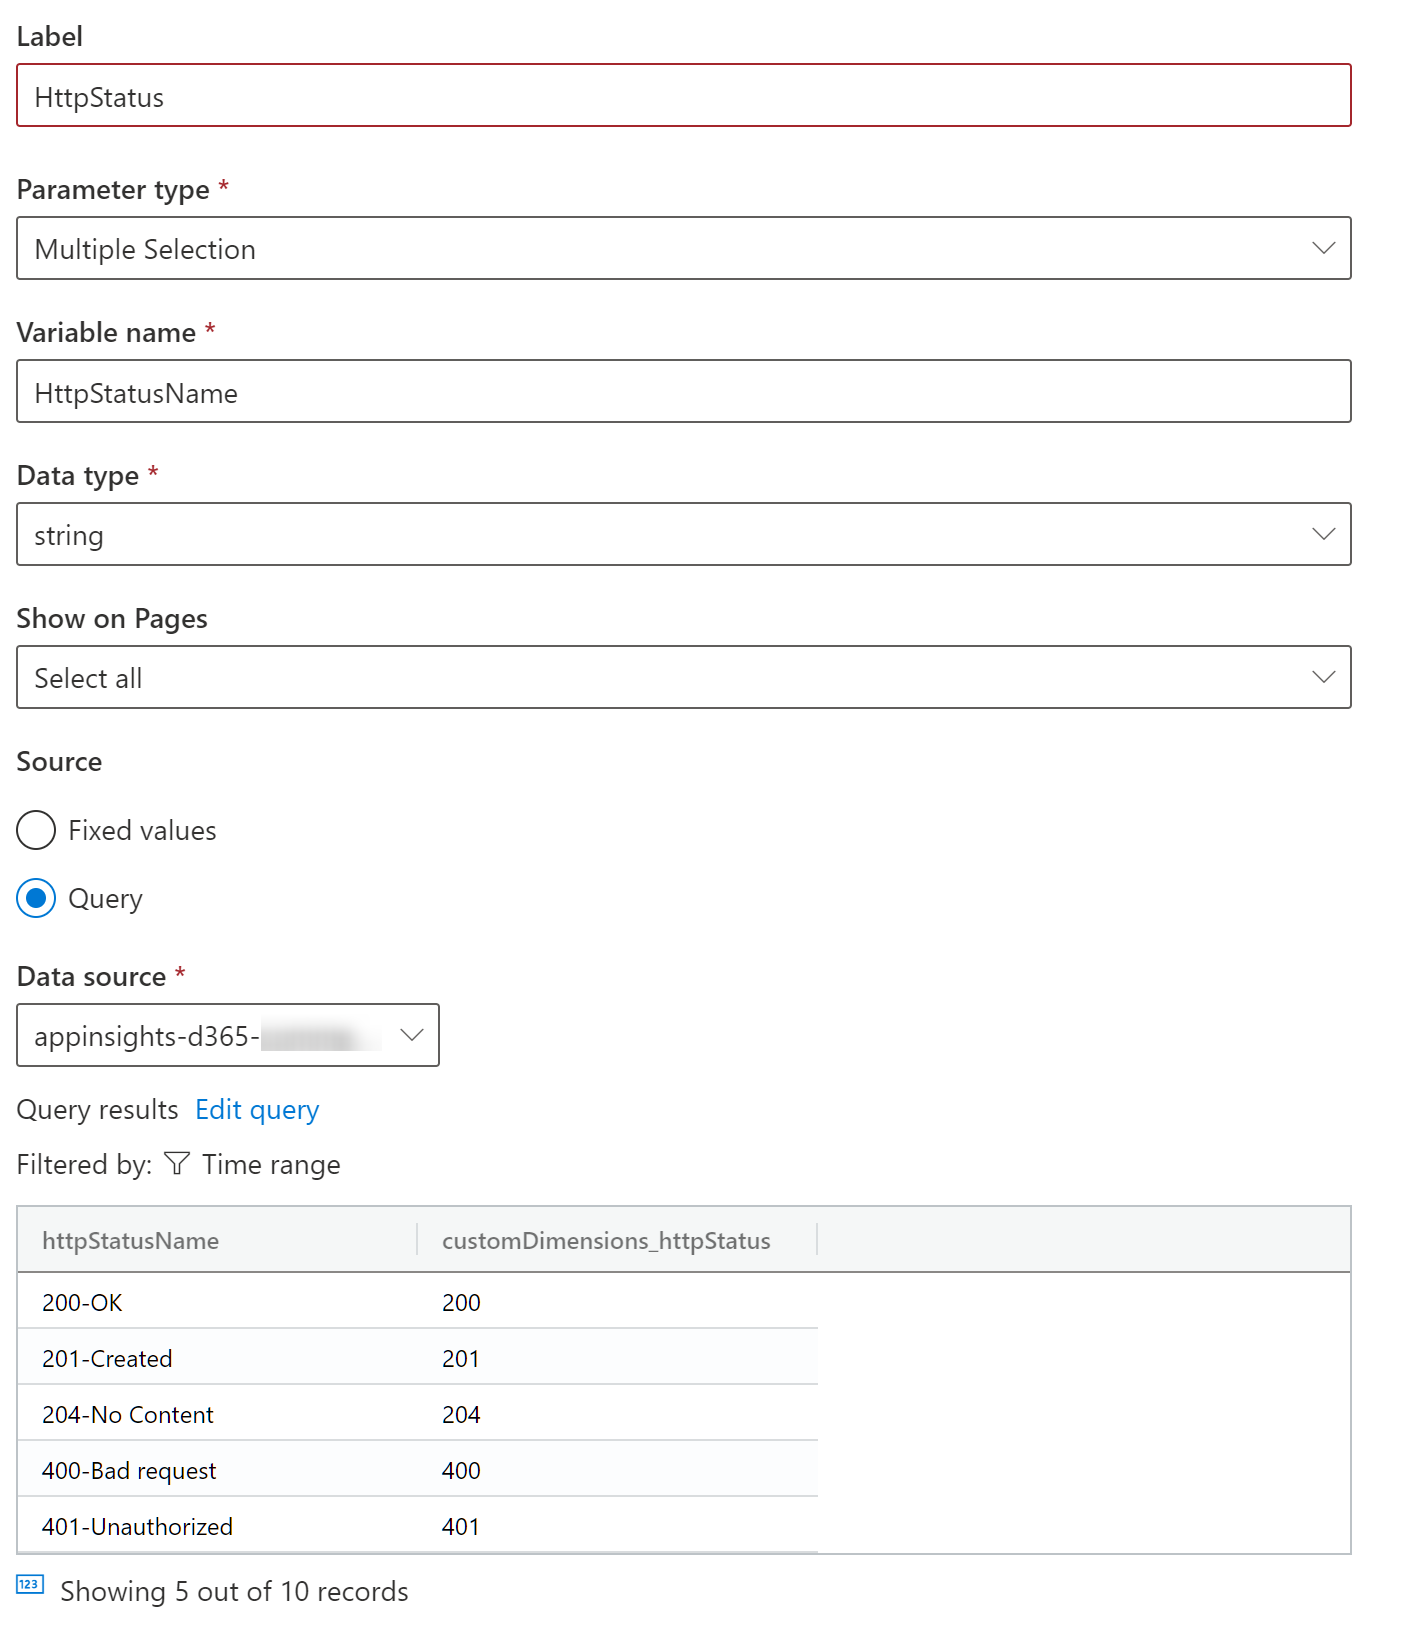
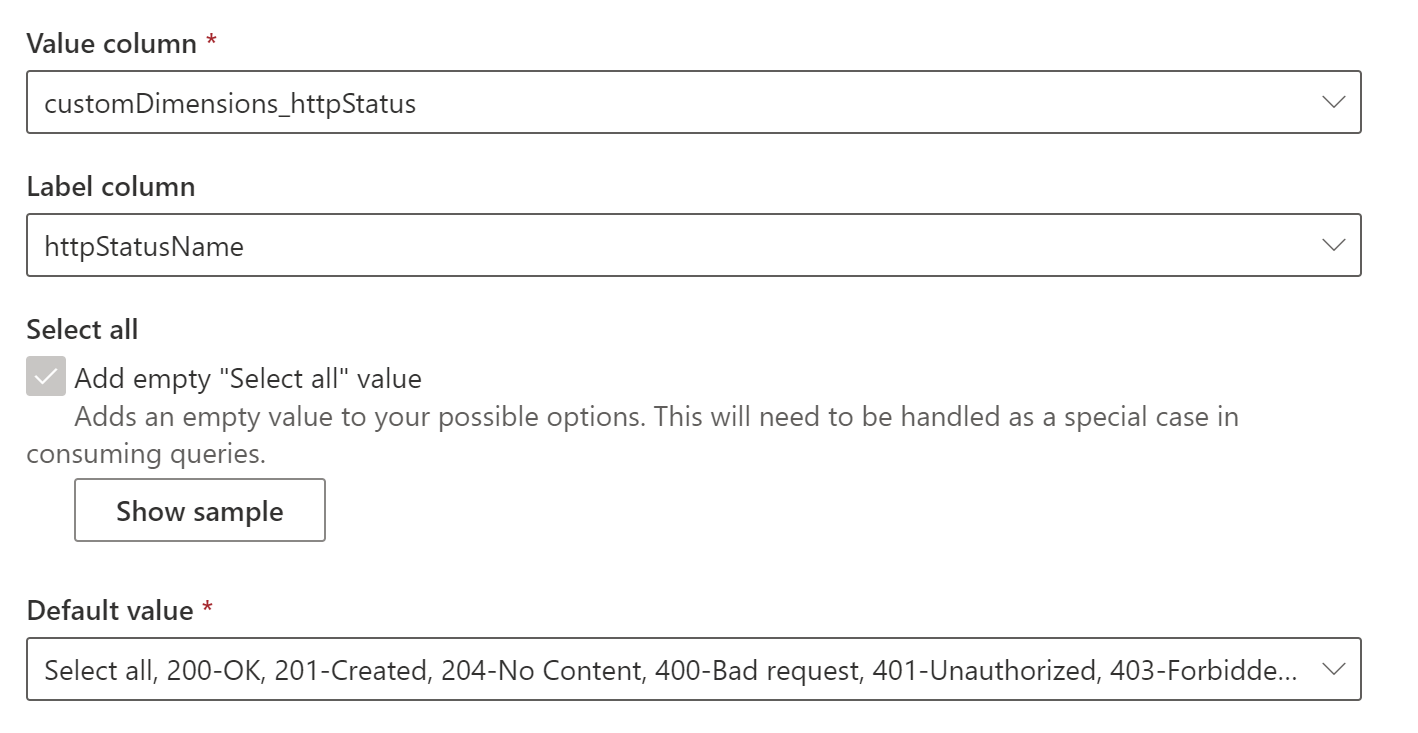
Create a new parameter “HttpStatus”. See details below
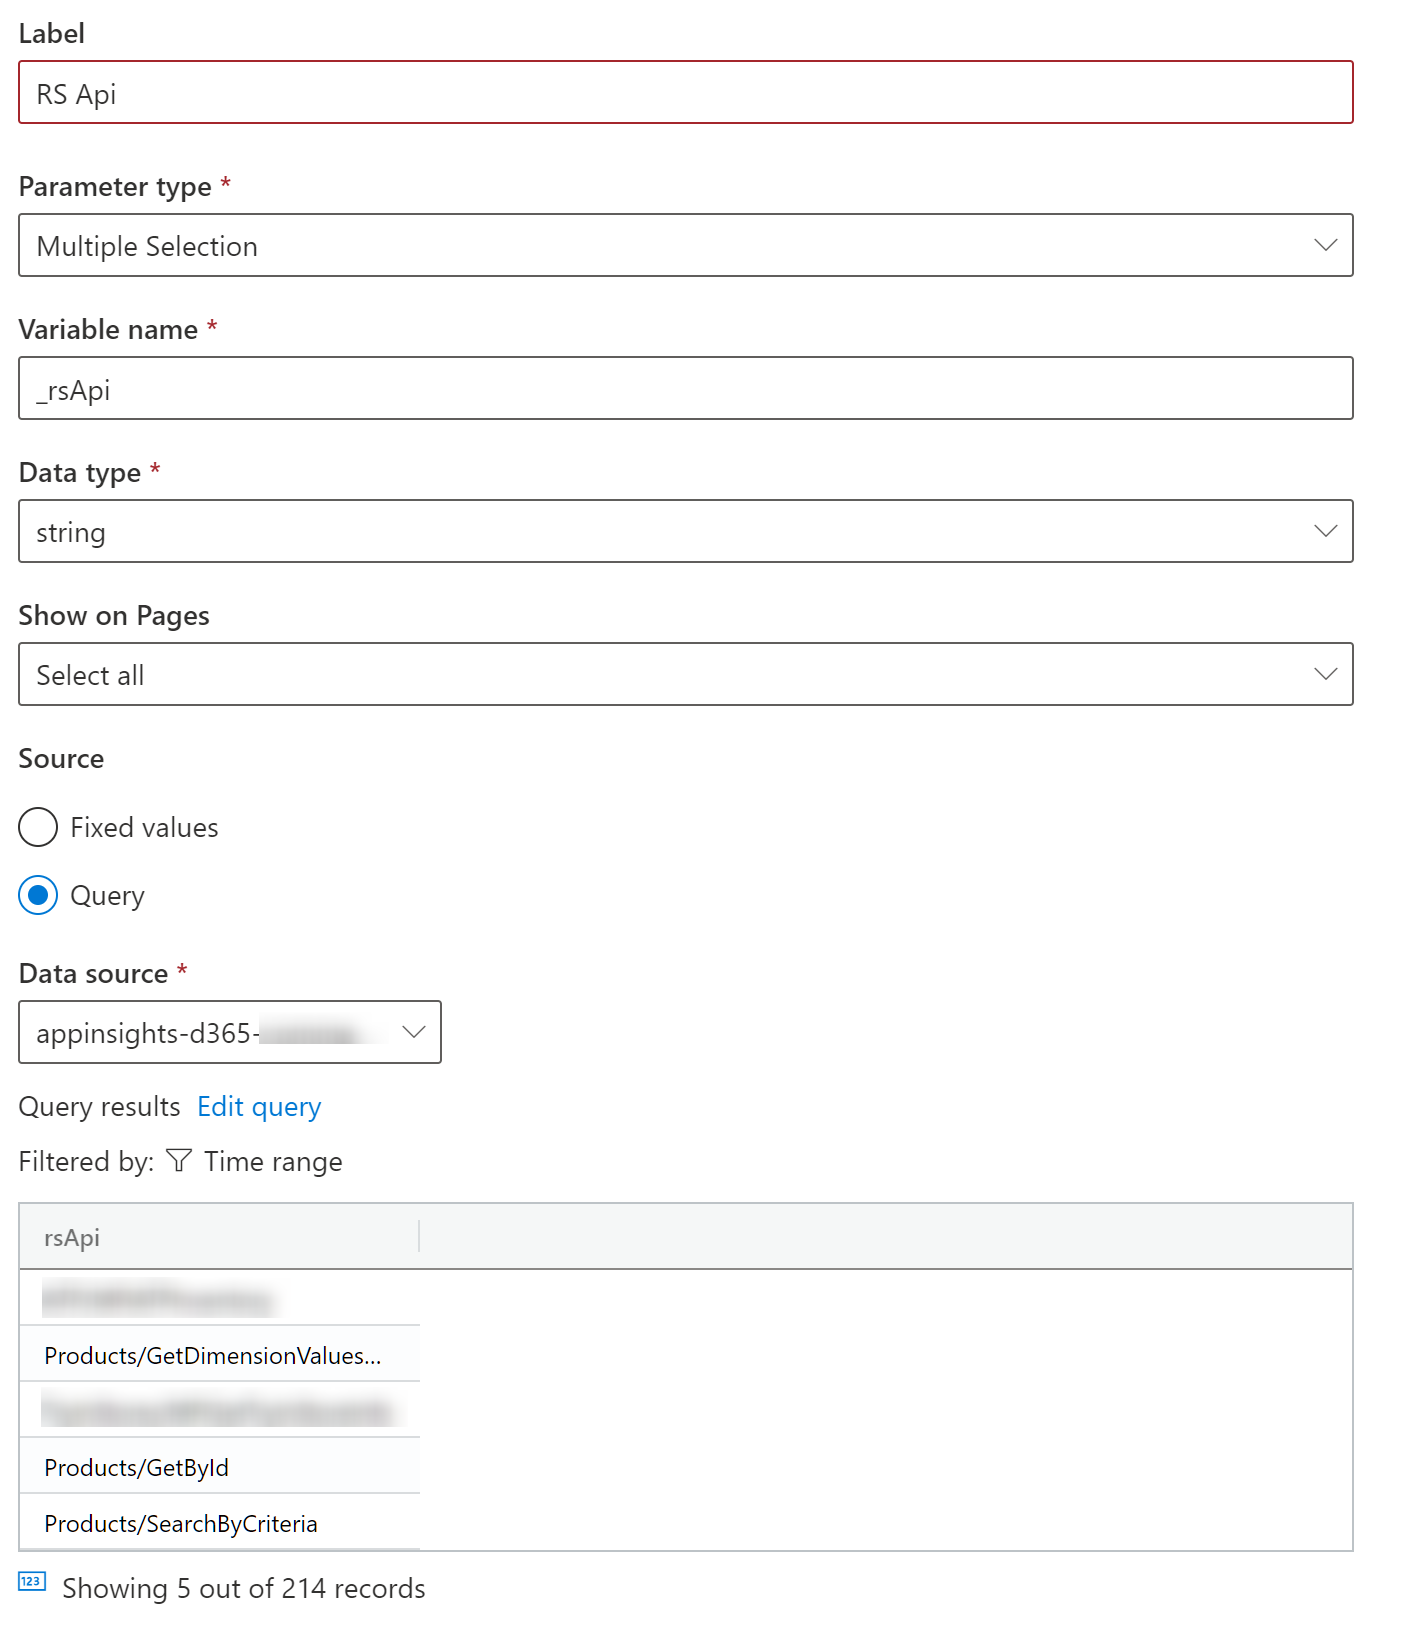
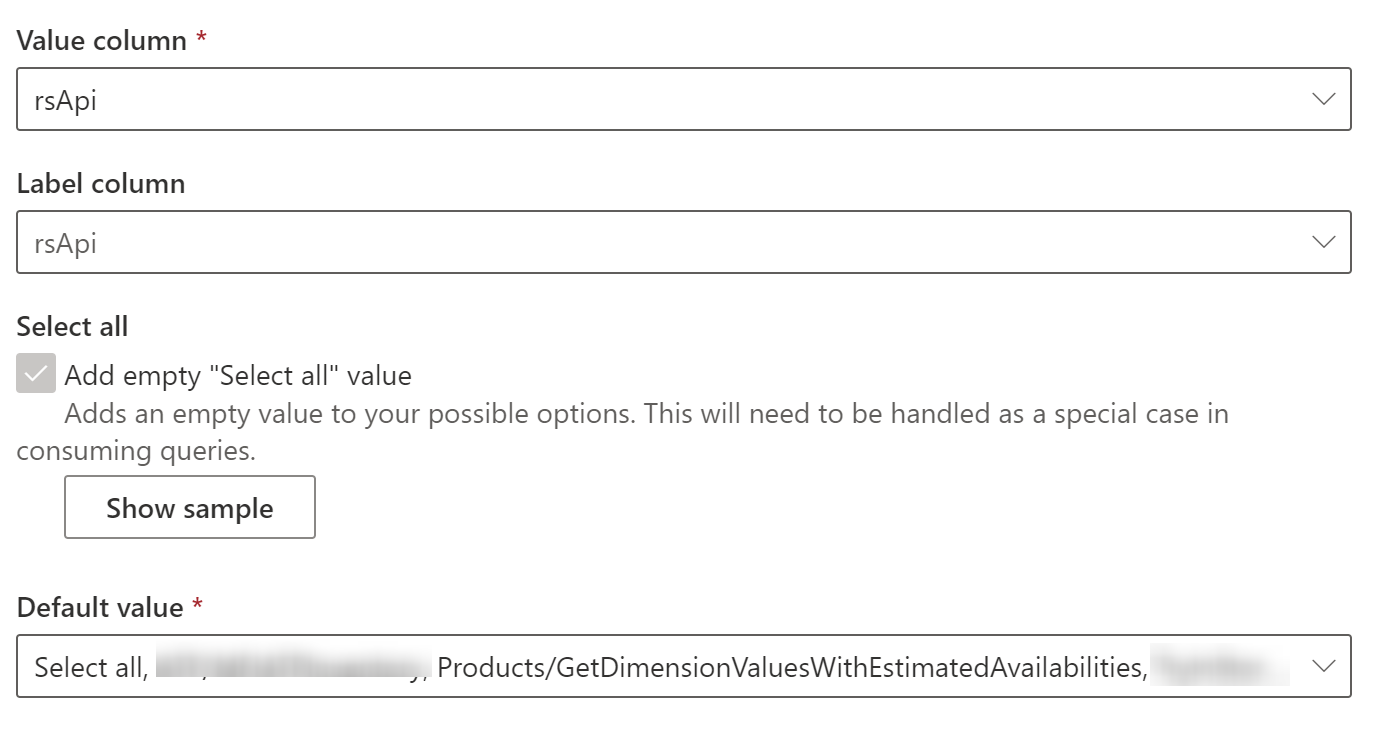
Create a new parameter “RS Api” as below
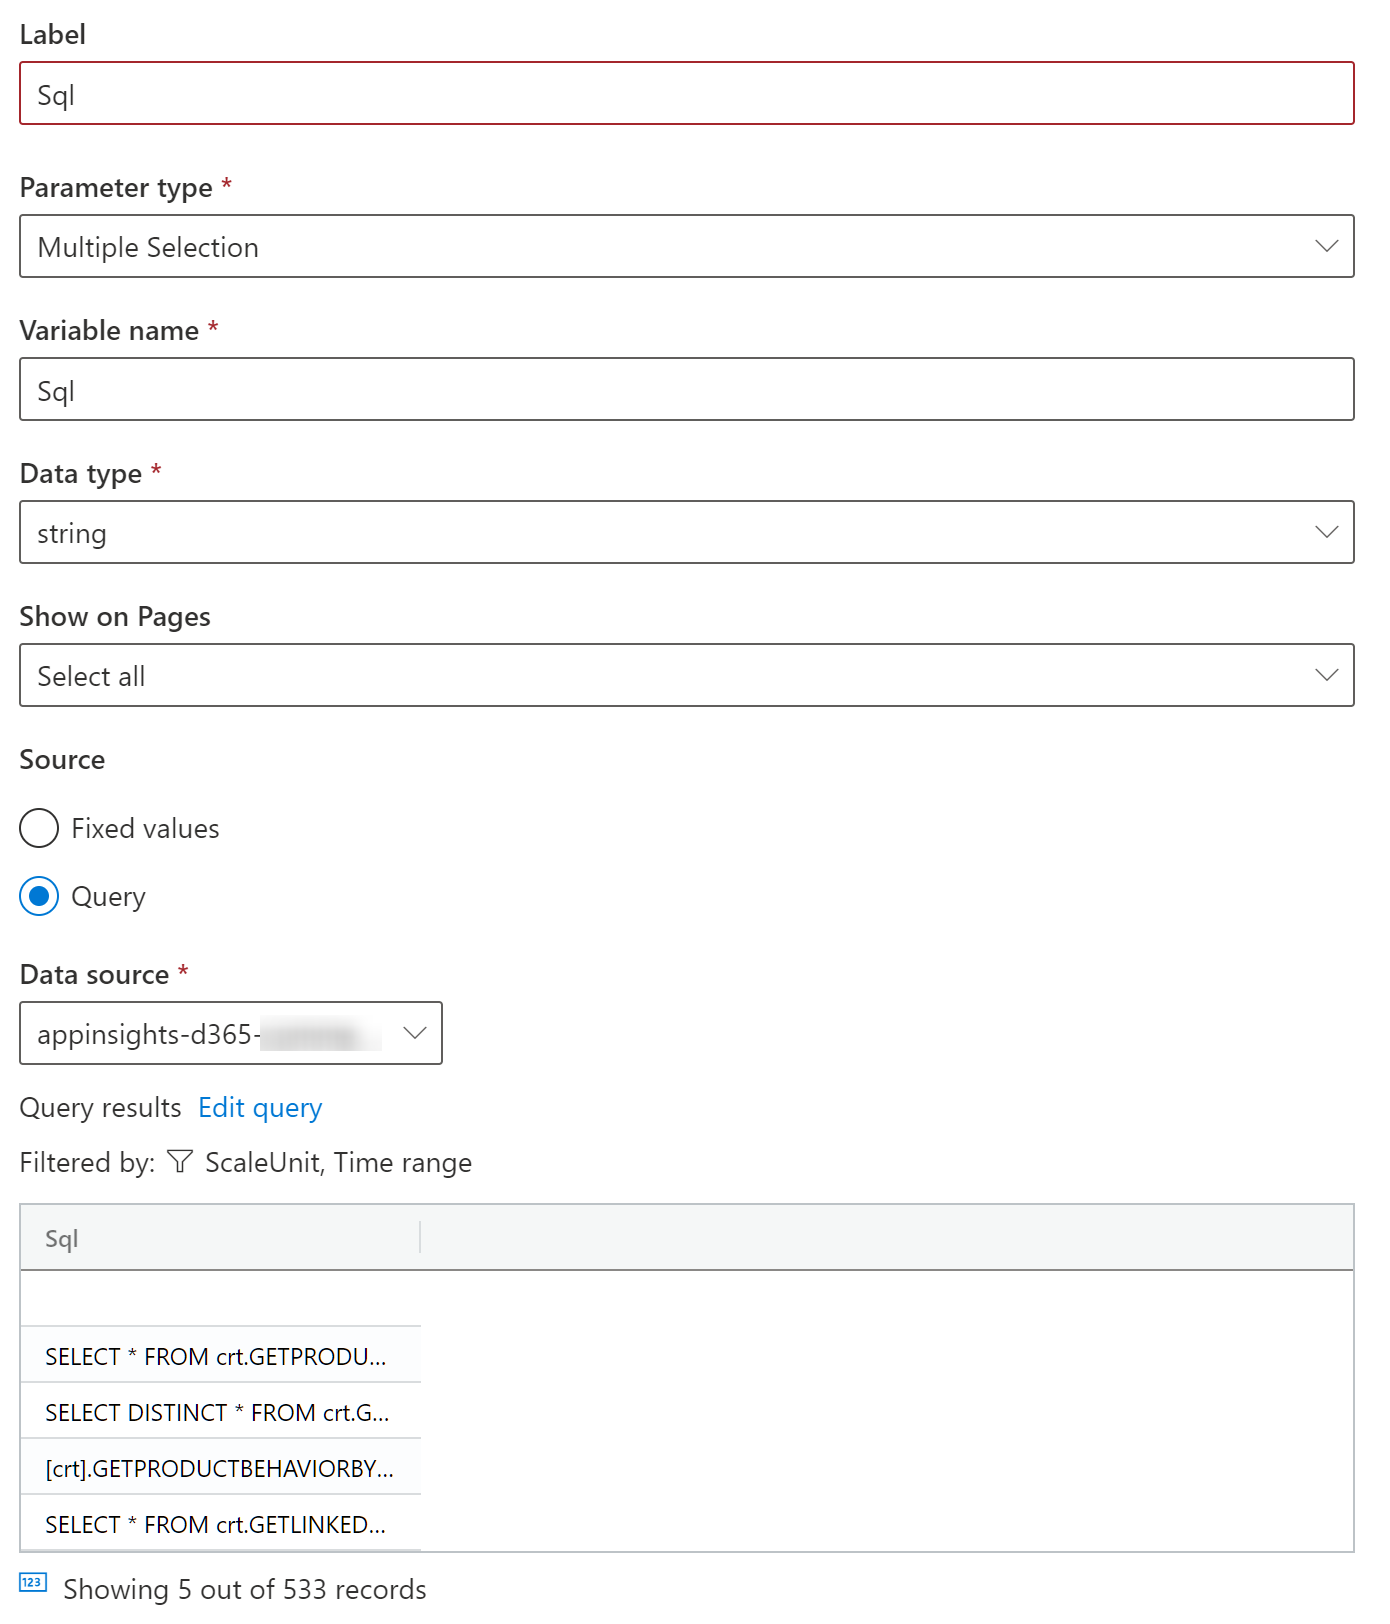
Create a new “Sql” parameter as below
At this point, we are done with the parameters. The dashboard should show these new query parameters:
The store-side business logic for Dynamics 365 Commerce is often extended with custom code. There are no limits to what a CRT extension can do. It can use process existing data from the database, can process data from extended tables, or can call external systems. Some of these changes to the out-of-box experience (OOBE) may impact performance negatively. Assuming the custom code is already optimized, meaning proper database indexes are applied, there may be cases when caching can lead to additional performance improvements. Note that there are ways to cache to the database, but in my experience memory caching is easier to implement and maintain. I have come across a few cases when caching was useful:
Calculation/fetching of local data is expensive. Data needed often enough that the processing impacts the experience. Data are not needed in real-time (some delay acceptable)
Calculation/fetching of local data from the database. Data are needed very frequently and even 50ms database calls may add up in total. Data are not needed in real-time.
Calling an external API (i.e. Real-time transaction service or other services). Data is needed frequently and data does not need to be real-time or changes rarely (i.e. secret keys)
Fetching data that is always static for a store, customer, cart, product, etc. but still expensive to fetch.
Cases 1 and 2 are similar to any data that can only be edited in the back office and need to be synced to the channel. Because of that, they are by definition not real-time data and could be cached further if its needed.
Focusing on the cases where the data is not real-time or truly external will usually give already good gains to the user experience.
There are some cases where data can also be written in the channel. These are usually a little trickier to cache. Think about saving customer data and still seeing the old data after refreshing. In some cases, these issues can be overcome, for example when the cache key is based not only on a simple key but maybe some other data that changed (i.e. cart, etc.).
Another important note: Since we are caching in memory of a web server and there are multiple load-balanced servers, there will be multiple caches. This does not present a large issue, as requests from a single user usually get routed to the same server.
Memory caching use cases
The different use cases (including proper logging as described here and memory cache implementation) discussed below are available for download.
Feel free to take a look or use for your project at your own risk. Let me know of any bugs.
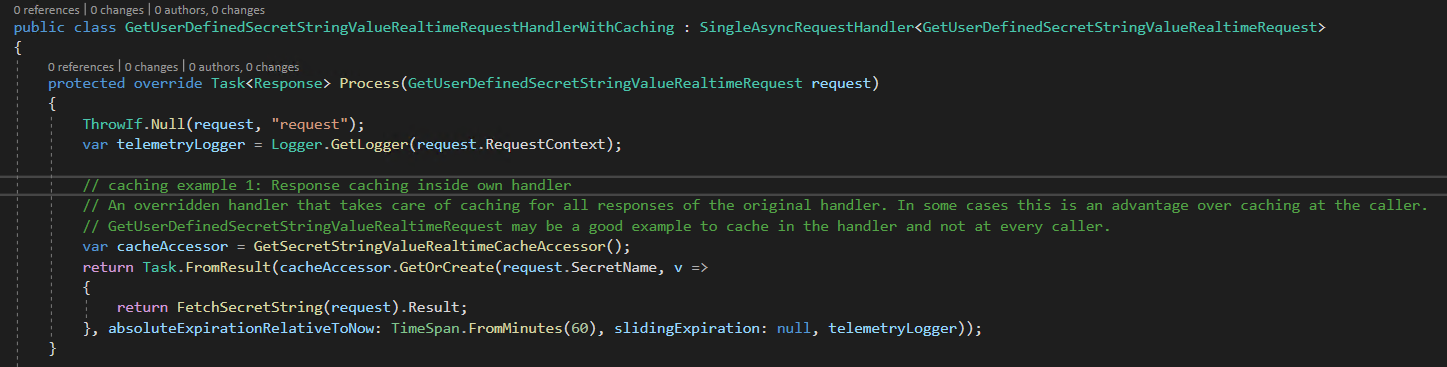
Case 1: Response caching inside own handler
You can override a request handler and have the new handler take care of caching for all responses of the original handler. In some scenarios, this is an advantage over caching at the caller. GetUserDefinedSecretStringValueRealtimeRequest is a good example to cache in the handler and not at every caller. We can assume that the secrets can be cached for a certain time safely.
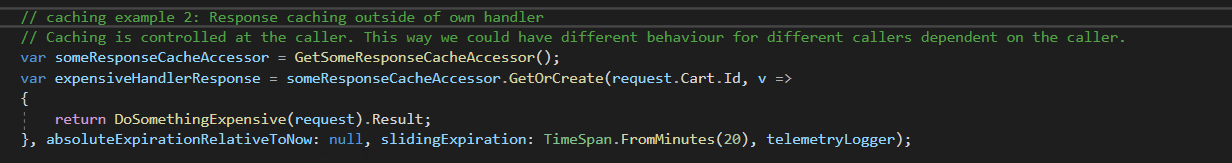
Case 2: Response caching outside own handler
In this case, the caching is controlled at the caller. This way we could have different behaviors for different callers, dependent on the caller. If the same caching code would have to be added to multiple places, and the same caching behavior is needed, consider use case 1 instead.
Case 3: Simple value caching outside own handler
This case is similar to case 2. The caching occurs at the caller. However, we may not always have a “proper” Response but a simple value to cache.
There are occasions when a customer, partner, consultant, or support engineer needs to look at the low-level Dynamics 365 Finance & Operations telemetry data. These use cases include troubleshooting of errors, performance-related investigations or just to gain some additional understanding of how the platform work. Telemetry data can be accessed by authorized users via the Environment monitoring part of the LCS portal, can be filtered in a few different ways and displayed inside the LCS portal’s raw logs section. A data grid can be used to inspect the log entries. LCS does not allow for more sophisticated pivoting and users can use Excel for that purpose. For that purpose, the telemetry data can also be downloaded formatted in CSV format.
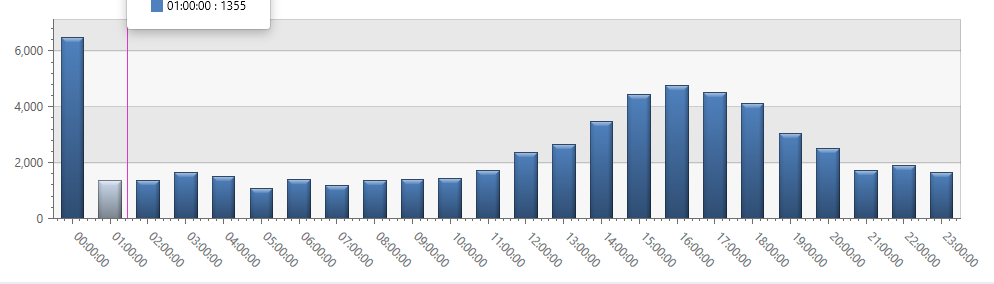
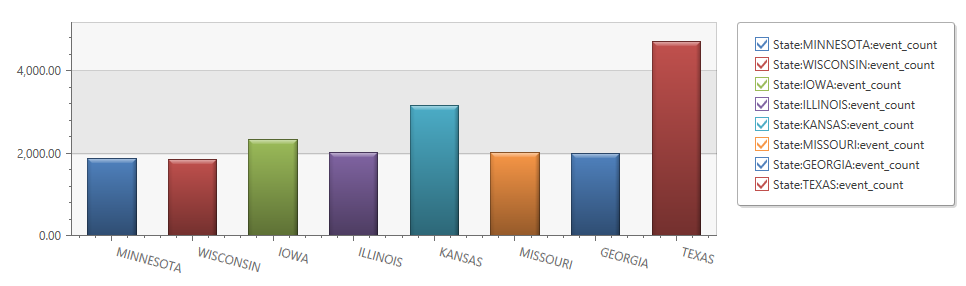
However, Excel is not the optimal tool for advanced querying of this data. The perfect tool, designed for this purpose is the Azure Data Explorer. It provides an innovative query language Kusto that is optimized for high-performance data analytics. Answering questions like “how often has a certain process taken place, how long has it taken in 90% of the times, how often per hour has a certain action taken place over the course of a day” becomes a lot easier and can be backed up with powerful graphics as well.
Here are examples how the graphics could look like:
A less known feature of the Azure Data Explorer is that it supports ingestion of CSV files. We can use it to get our CSV data files uploaded and staged so it can be queried with the Kusto language. If you have not setup Azure Data Explorer Cluster, follow these steps.
Steps to upload to Azure Data Explorer
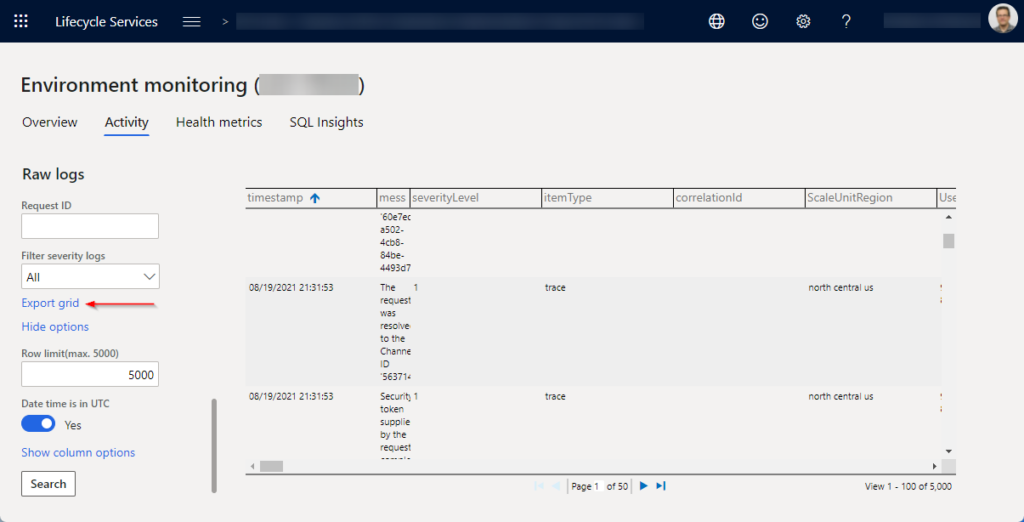
Run your query on LCS raw logs page
Important: adjust the time interval or – filter to get to the right data (row limit is 5000 for export in next step)
export the grid to Excel
Open the file in Excel and save it without making any changes (this seems to fix a formatting issue)
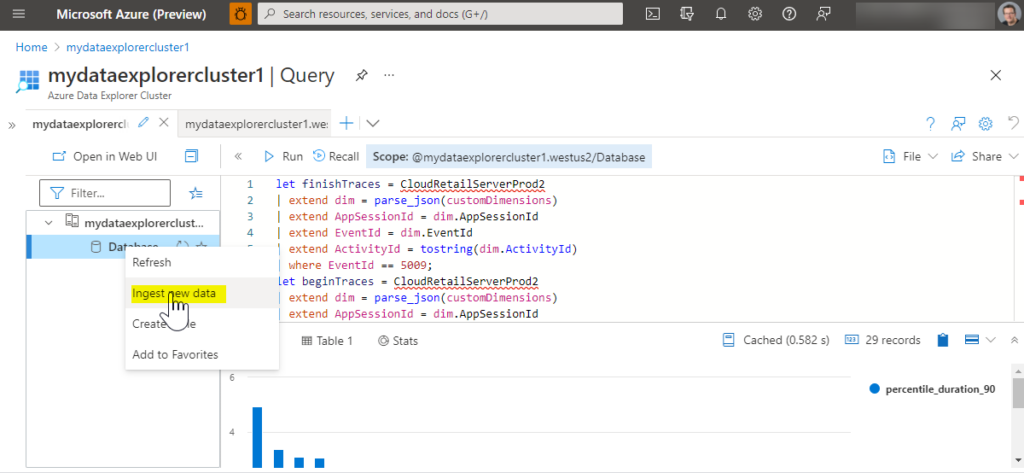
In your Azure Data Explorer, right click on the cluster in the tree view and select “ingest new data” and then on the next page “ingest data from a local file”
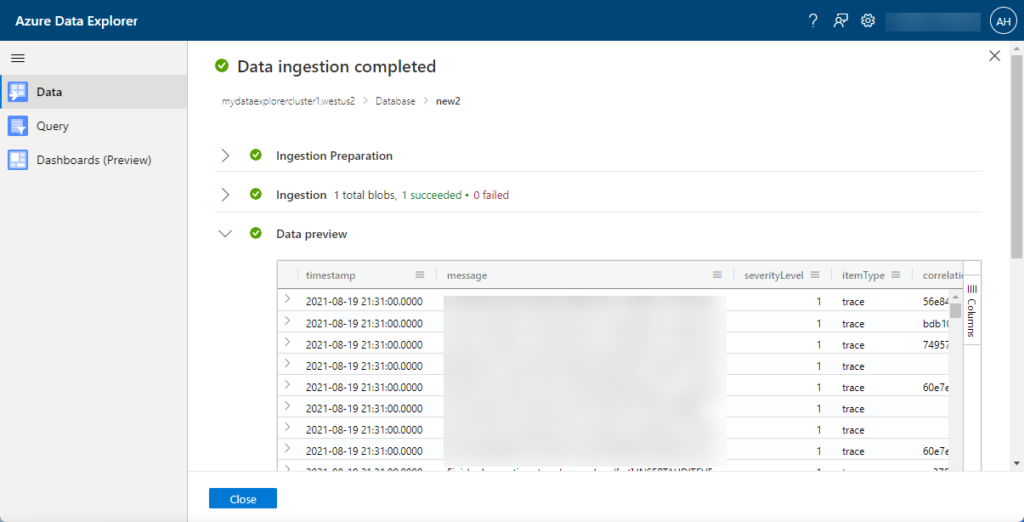
Pick your cluster, name a new table for the data to be imported into, select up to 10 CSV files to import, select CSV format. Hit next a few times till your data is getting imported.
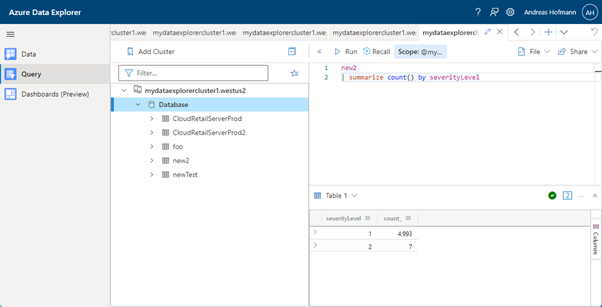
Use the Query tile to write a Kusto query against your data.
To learn more about the Kusto query language, go here.
Sample queries
Modern POS
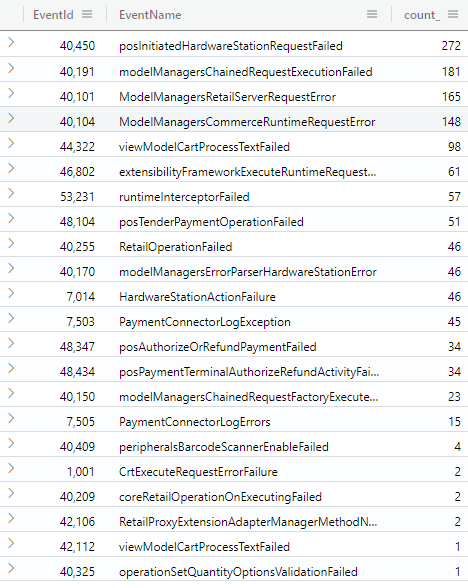
all errors
Sometimes its nice to get an idea of what all the errors are. The use of the text fields to describe errors is not consistently used, so its better to use the EventIds and map them to the correct errors. They can be looked up in these two Commerce SDK files (but using the code snippet below may give you all of them already):
A next step would be to go through each of these error types, and look at them closer. A few of those could indicate quality issues that could effect the user experience.
In many cases, these errors can be fixed by cleaning up the extended code, adding proper SQL indexes or investigate better problem approaches.
In some cases, these errors could indicate problems with out-of-box experience (OOBE) or deployment. Please open a support request to get these fixed by Microsoft.
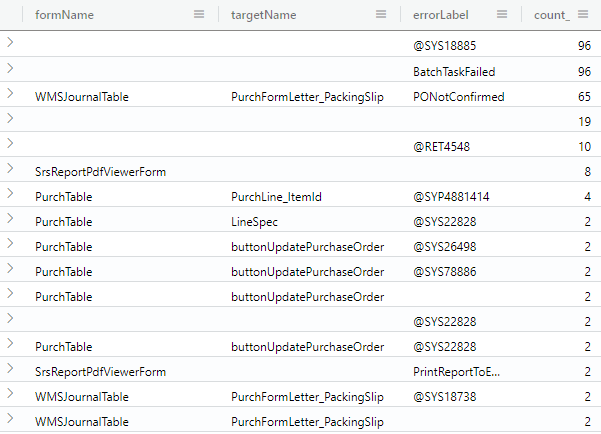
// Note: use selection "All error events" to only get the errors
FNOErrors24h
| summarize count() by formName, targetName, errorLabel
| order by count_ desc
FormName, targetName, errLabel are all good candidates to look up in Azure DevOps to find out the code location. That gives more insight in what areas these error occur.
Example: The @SYS18885 is thrown from ReqPlanData class. Now I can focus on figuring out why that is the case (is Master planning not configured right?)
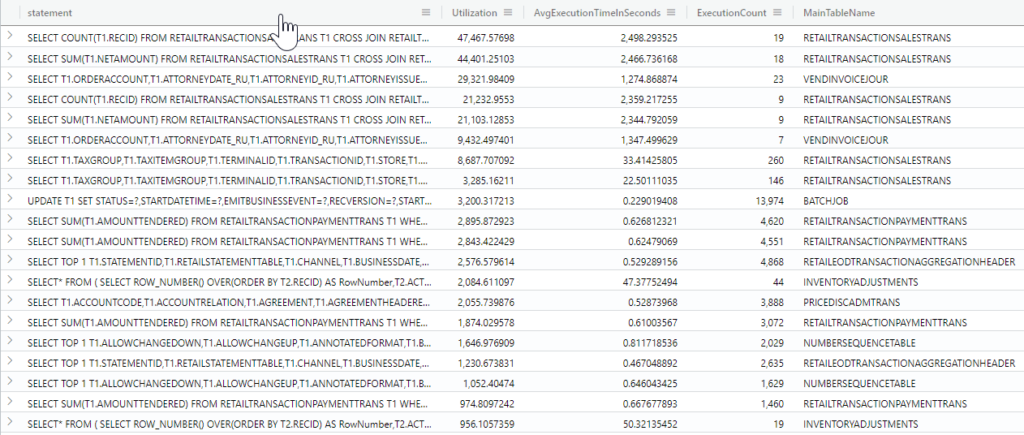
Slow SELECT queries
// use selection "slow queries" in LCS diagnostics
SlowQueries
| extend MainTableName = extract("FROM\\s([A-Z0-9]+)\\s", 1, statement)
| where statement contains "SELECT"
slow inserts
// use selection "slow queries" in LCS diagnostics
SlowQueries
| extend MainTableName = extract("INSERT INTO ([A-Z0-9]+)\\s", 1, statement)
| where statement contains "INSERT"
Slow deletes
// use selection "slow queries" in LCS diagnostics
SlowQueries
| extend MainTableName = extract("DELETE FROM ([A-Z0-9]+)\\s", 1, statement)
| where statement contains "DELETE FROM"
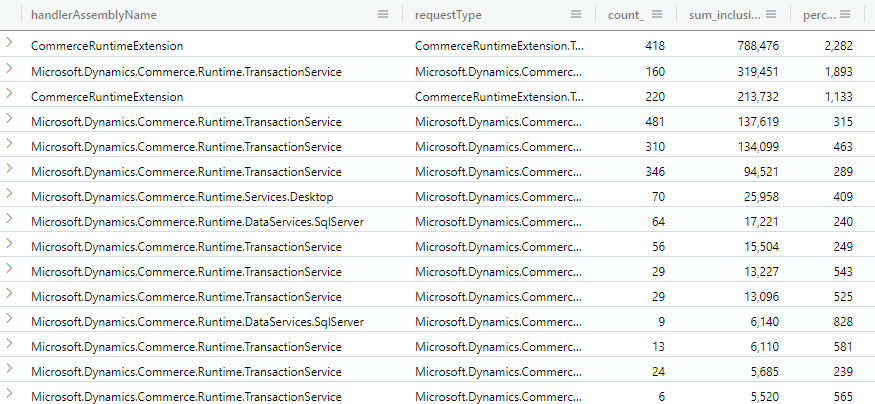
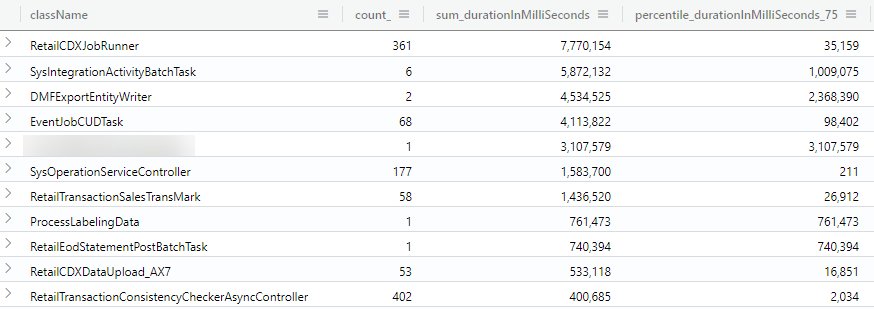
Batch jobs performance
// use selection "All logs" and add query "where TaskName Equals BatchFinishedOneTask" in LCS diagnostics
BatchFinishedOneTask
| summarize count(), sum(durationInMilliSeconds), percentiles(durationInMilliSeconds, 75, 90) by className
| order by sum_durationInMilliSeconds desc
The CommerceRuntime is the business logic for Retail POS and other channels. Here are a couple of good rules how to correctly configure it.
In both of the commerceRuntime.*.ext files, be specific about what handlers you want. Do not use a wildcard inclusion for the whole assembly. If you do the latter, you have no choice about what handlers are disabled, etc. The example below should help.
Even though you could write code that figures out where the runtime context is online or offline, its not a good practice. Its better practice to use the config file to control that. See example below.
To enable different functionality for online and offline scenarios, you have multiple options:
If you do not want/need offline mode at all, either disable the feature for that register OR install the installer that does not include the offline part.
If you want just the built-in offline features (fewer features than online), you can have an empty CommerceRuntime.MPOSOffline.Ext.config file
If you want what you get in 3.2) with the addition of a few custom-built features, you can have some of the entries in the CommerceRuntime.MPOSOffline.Ext.config file.
If you want what you get in 3.2) and all of your custom-built features, you should have the same entries in CommerceRuntime.MPOSOffline.Ext.config and CommerceRuntime.Ext.config
Notice that the config files are almost the same, with the one difference that the online version has 3 more handlers (ProductAvailability, PurchaseOrder related). Those are based on RTS calls which cannot be done in offline mode.
There may be a time during a Retail project when you likely will hear someone saying: “Doing X in POS is slow. What’s going on?”. If this is the case, my hope is that this during the implementation phase and not on a live production environment.
What do we do to find out what is wrong? Is it a customization to the CRT business logic, latency to an external call, generic latency to the server from POS, or a Microsoft bug?
The following steps will hopefully help to give an answer to these questions.
RetailServer could be either Microsoft hosted or RSSU-hosted. It is agnostic to this investigation, but you need to make sure you are testing against the right RetailServer (especially if you use both Microsoft-hosted and RSSU-hosted at the same time).
Microsoft-hosted RetailServer in production cannot be accessed, so some of the steps below cannot be carried out on a production environment. It is advised to carry these out on a lower tier environment.
RSSU-hosted RetaiSserver, even in production, is under the management of the customer, so the steps below can be carried out, but with care.
Sometimes the slowness could occur only when there are multiple POS used at the same time. If that is the case, you can still use the steps below, but would have to reproduce the issue by running multiple POS.
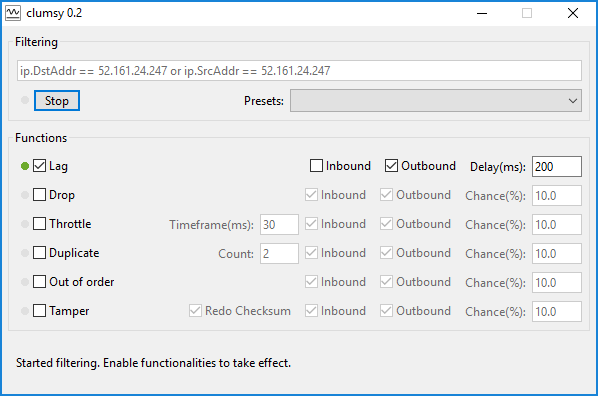
In some cases it is very useful to see how a web site would perform under certain network conditions that are worse than what you have currently. You can use this tool to simulate it: https://jagt.github.io/clumsy/. As an example, if you want to simulate what a network latency of 200ms looks like while using POS, run it on the same computer as POS and configure it with 200ms outbound.
Even if you are on a good network, with this tool you can evaluate what it would look like for someone with higher latency (or other network conditions).
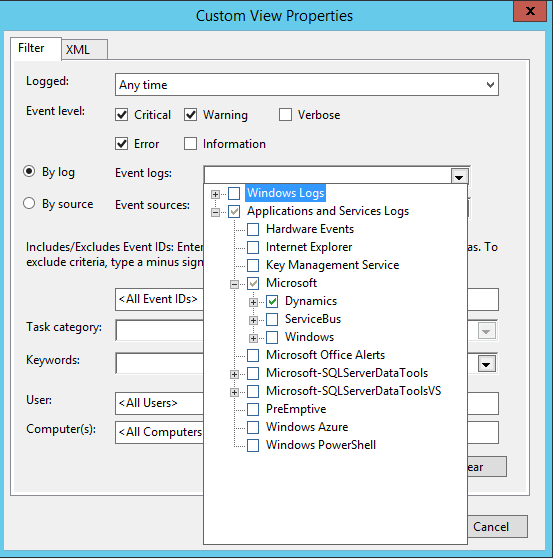
One solution is to look at all EventLog entries for anything “Dynamics”. Here is how to do it:
Open the EventViewer.
Custom Views/Create new custom view.
Select Event levels you want to see.
Select the Event logs you want to see. Here, make sure you select Applications and Services Logs/Microsoft/Dynamics
Hit OK and call it “Dynamics”.
This video demonstrates how to store application settings securely and manage them in AX. These settings are needed for AX business logic and CommerceRuntime business logic. The data is fetched via a RetailTransactionServiceEx call. The CommerceRuntime service takes care of calling the RTS and caching for a configurable period. Video also shows how to test this by exposing it via RetailServer and using the RetailServer TestClient.